What is Prometheus, Prometheus is an open-source, Cloud Native Computing Foundation project responsible for monitoring metrics, events, and alerting. The project was released in 2015.
Have you ever been curious about the various tools that are available to offer 24-7 information about our systems, aid in faster recovery, and prevent system downtimes 😪?
In today’s rapidly evolving tech landscape, monitoring and observability are crucial for ensuring the health and performance of your applications and infrastructure. Prometheus, an open-source monitoring and alerting toolkit, has become a go-to solution for many organizations looking to gain insight into their systems.
In this blog, we’ll explain what Prometheus is and provide a step-by-step guide on how to set it up.
🤔What is Prometheus?
It gathers metrics from configured targets at given intervals, analyzes alert rules/expressions, and has the ability to send alerts when certain conditions are satisfied.
It’s responsible for collecting and recording the metrics from different targets like servers, docker containers, K8s clusters, and applications. In addition to that, it also provides a flexible query language just like we have SQL known as PromQL for easiness of querying, it also provides an alerting mechanism that helps in sending notifications as per requirement.
✅ Prerequisites
- Basic knowledge of the Linux command-line interface (CLI)
- Ubuntu server with Version > 14.04
👇 Installing Prometheus
Step 1: Update the System Packages
To make sure you are utilizing the latest recent packages, you should first update the package list on your system. You can do this by giving the following command:
sudo apt update
Step 2: Install Prometheus in a Directory
To store configuration files and libraries for Prometheus, we will create a new directory and install Prometheus in this new directory /opt/Prometheus. Use the commands below to create the directories
Create a directory:
mkdir /opt/Prometheus
cd /opt/
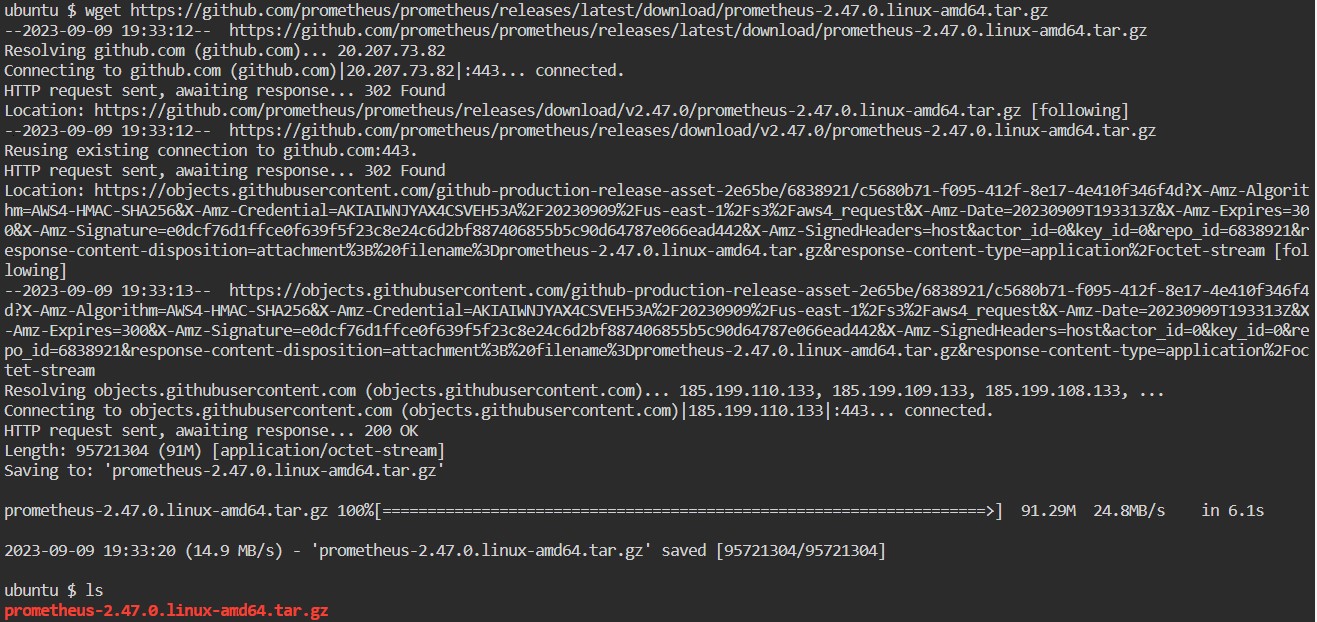
Download the latest version of Prometheus with the WGET command:
You can replace the <LATEST-VERSION> with the Prometheus version, you want to install from the Releases page.
wget https://github.com/prometheus/prometheus/releases/latest/download/<LATEST-VERSION>-amd64.tar.gzFor example, if you want to download Prometheus version 2.47.0, the command would be:
wget https://github.com/prometheus/prometheus/releases/latest/download/prometheus-2.47.0.linux-amd64.tar.gz
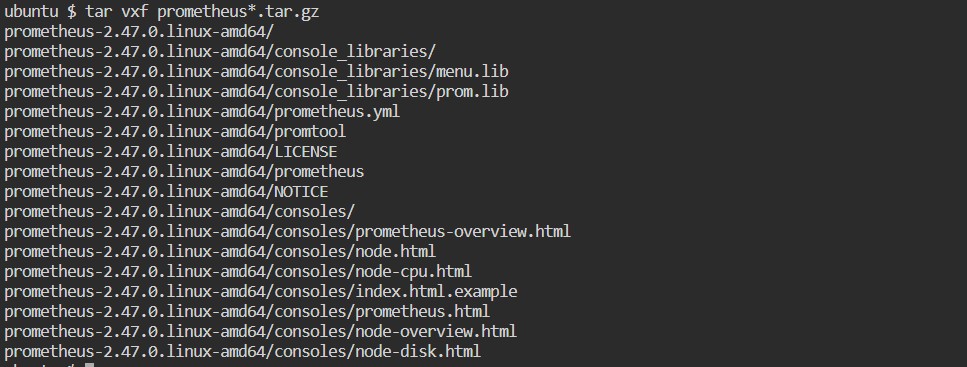
Extract the .tar.gz files.
Afterwards, we move the Prometheus and Promtool files from the Extracted Prometheus folder to /opt/Prometheus
tar vxf prometheus*.tar.gz
mv prometheus-2.47.0.linux-amd64 Prometheus 
Step 3: Creating the Prometheus Systemd service
Now, since we have finally installed the Prometheus, Let’s create a system service for Prometheus to be running on specific ports and expose metrics.
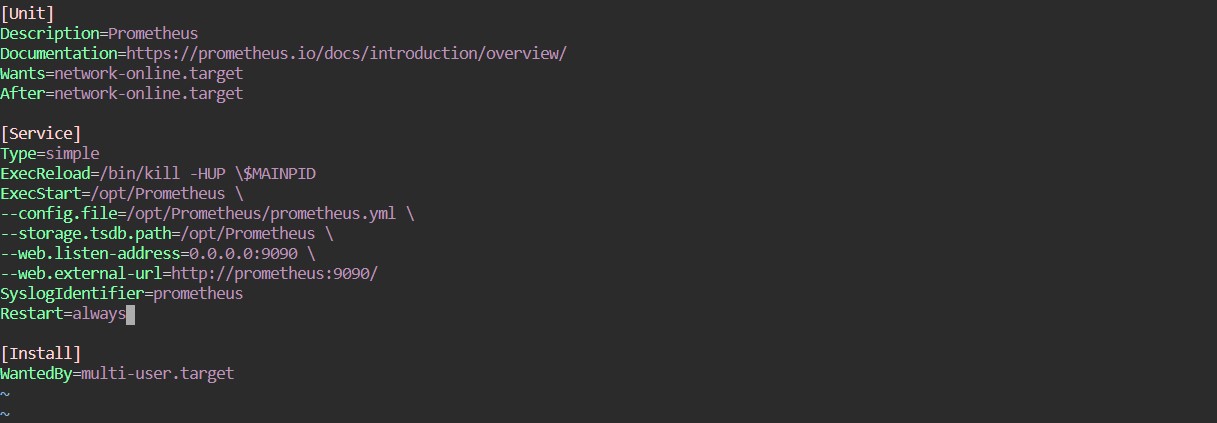
Using the vim text editor, make and open a prometheus.service file by using:
vi /etc/systemd/system/prometheus.service
[Unit]
Description=Prometheus
Documentation=https://prometheus.io/docs/introduction/overview/
Wants=network-online.target
After=network-online.target

[Service]
Type=simple

ExecReload=/bin/kill -HUP \$MAINPID
ExecStart=/opt/Prometheus \
--config.file=/opt/Prometheus/prometheus.yml \
--storage.tsdb.path=/opt/Prometheus \
--web.listen-address=0.0.0.0:9090 \
--web.external-url=http://prometheus:9090/
SyslogIdentifier=prometheus
Restart=always

[Install]
WantedBy=multi-user.target
Step 4: Reload Systemd
After saving the prometheus.service file, you must reload the system configuration files in order for the system to take note of the changes. Use the following to reload the system configuration file:
sudo systemctl daemon-reload
Step 5: Start Prometheus Service
Next, start the Prometheus service. Use the following commands:
sudo systemctl enable prometheus
sudo systemctl start prometheus
Step 6: Check Prometheus Service Status
Check the status of the Prometheus Service by using the command:
sudo systemctl status prometheus
Step 7: Access Prometheus Web UI
If you face the issue at Step 6, and after checking the status of the service, if this shows NOT ACTIVE , it could be due to the port issue as we haven’t enabled the 9090 port on the server.
If there are some other issues due to which Prometheus is not running, you can use the following steps:
Check Prometheus Logs: Check the Prometheus logs for any specific error messages or issues. You can view the logs using the journalctl command:
journalctl -u prometheus.serviceLook for any error messages or clues as to why Prometheus is failing to start. This can help pinpoint the issue.
You must enable port 9090 on your firewall because Prometheus by default operates on port 9090. To do this, enter the following command:
sudo ufw allow 9090/tcp
If Prometheus is successfully launched, we can try to open localhost:9090 or ip_address>:9090 into your web browser.

What is Promtool?
A command-line tool called promtool is included with Prometheus and offers a number of useful features for working with Prometheus configuration files and rules.
Promtool is installed inside the /opt/Prometheus folder.
The check subcommand of promtool can be used to verify rules and validate Prometheus configuration files. This is how to use it:

./promtool check config prometheus.ymlWe can also use this to verify the alert rules that we have created before directly restarting the Prometheus service.
If you have alerting or recording rules defined in separate files, you can use promtool to check those as well. For example, if you have an alerting rules file named alerts.rules.yml, you can check it like this:
promtool check rules /path/to/alerts.rules.yml
Replace /path/to/alerts.rules.yml with the actual path to your rules file. This command will validate the rules file for correctness.
./promtool check config /path/to/alerts.rules.ymlCheck All Rules in a Directory:
To check all rules files in a directory, you can use a wildcard * to specify all the rule files in that directory:
promtool check rules /path/to/rules-directory/*.rules.ymlReplace /path/to/rules-directory with the actual path to your directory containing rules files.
promtool will provide feedback on any issues it finds in your configuration or rules files, helping you identify and fix potential problems before starting Prometheus. This is particularly useful for avoiding configuration errors and ensuring the correctness of your alerting and recording rules.
Remember to run these promtool checks whenever you make changes to your Prometheus configuration or rules to ensure that your monitoring setup remains reliable and accurate.
By following the steps in this guide, you can set up Prometheus for your monitoring needs.
👍 Please share this article if you found it helpful.
Please feel free to share your ideas for improvement with us in the Comment Section.
🤞 Stay tuned for future posts.
Feel free to contact us for any more conversations regarding Cloud Computing, DevOps, etc.
Our Recent Posts
- How to mute the alerts for a particular time in Alert Manager?
- How to Monitor your Kubernetes Cluster using Prometheus Easily – Beginners Guide
- How to setup and monitor Endpoints using Blackbox Exporter in Prometheus using simple Steps?
- How to setup a monitoring for TCP Endpoints using Blackbox Exporter in easy steps?
- How to Set Up Federate Jobs in Prometheus: A Simple Guide to Understanding Federate Jobs
I’m a DevOps Engineer with 3 years of experience, passionate about building scalable and automated infrastructure. I write about Kubernetes, cloud automation, cost optimization, and DevOps tooling, aiming to simplify complex concepts with real-world insights. Outside of work, I enjoy exploring new DevOps tools, reading tech blogs, and play badminton.
Subscribe to our Newsletter
Please susbscribe


