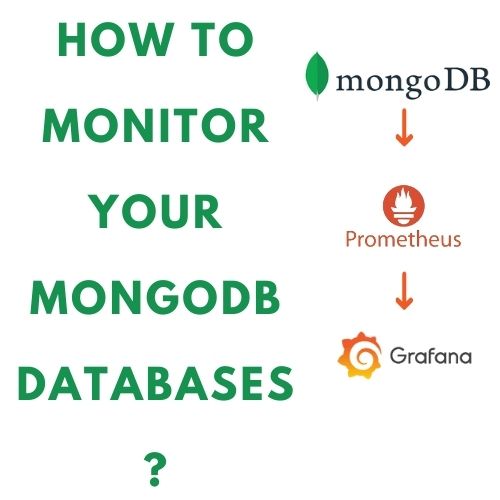
MongoDB (Mongo Databases) is a widely used NoSQL database for various applications. To make sure it runs well, it’s critical to keep an eye on its performance. An effective tool to do this is Prometheus, an open-source monitoring and alerting toolbox. We will take you step-by-step through the process of using Prometheus to monitor and operate the MongoDB Exporter.
MongoDB is simple to scale for read/write operations when used as a document storage. Data can be saved in a JSON structure, which makes it simple to interact with computer languages like JavaScript that accept JSON natively.
Since Database monitoring is an essential component of modern software engineering, it can be difficult to find problems in production environments and improve application performance without appropriate monitoring.
NoSQL MongoDB is a popular document-oriented database that is widely used for its scalability, performance, and flexibility. Because of its horizontal scalability and capacity to manage unstructured data, MongoDB is a popular option for modern online applications.
A tool called the MongoDB Exporter makes MongoDB metrics available in a format that can be scraped by Prometheus. You have two options for deploying the MongoDB Exporter: a Docker container or a standalone binary. Versions of MongoDB 3.0 and higher are supported by the MongoDB Exporter.
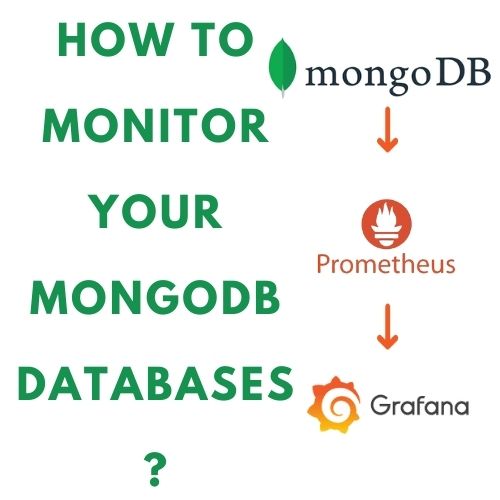
Now let’s use Prometheus and the MongoDB Exporter to monitor MongoDB.
Prerequisites
Before we get started, make sure you have the following prerequisites:
- A MongoDB instance running on your system or a remote server.
- Prometheus is installed on your system or a remote server.
- Grafana installed on your system or a remote server (optional).
Installing the MongoDB Exporter
The MongoDB exporter can be found on Percona’s GitHub page.
As usual, we will configure the MongoDB exporter as a service, even though it is provided as a binary file in an archive.
Additionally, we’re going to create a user and set it up so that it can be just used for monitoring.
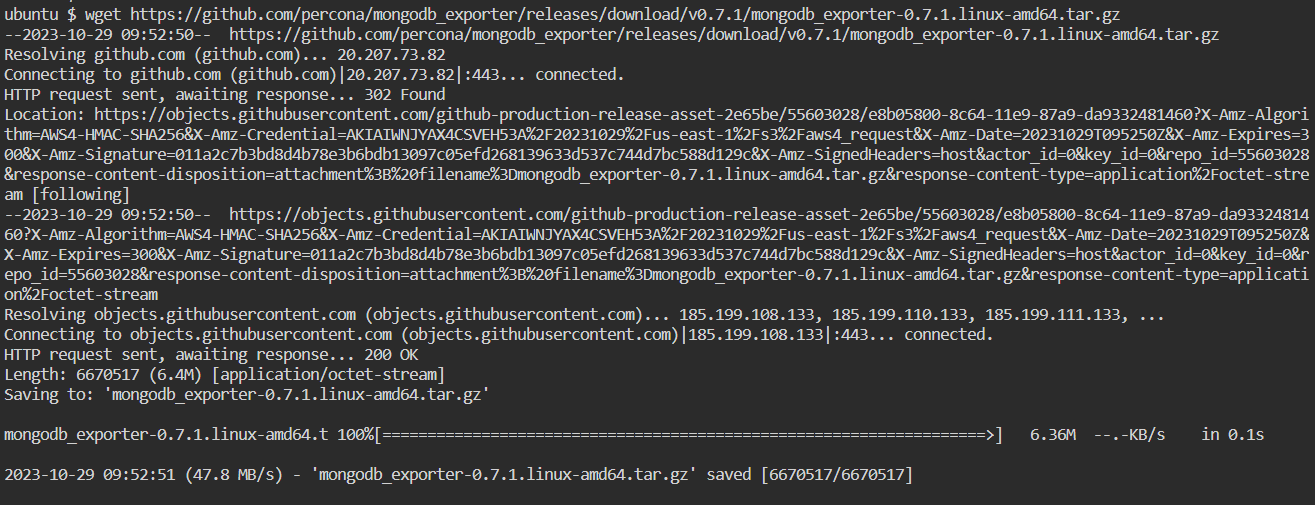
First, choose a version to get the MongoDB exporter release file from here.
mkdir /opt/mongodb_exporter
cd /opt/mongodb_exporter
Next, extract the downloaded archive in your current folder.
wget https://github.com/percona/mongodb_exporter/releases/download/vX.Y.Z/mongodb_exporter-X.Y.Z.linux-amd64.tar.gz

tar xzvf mysqld_exporter-X.Y.Z.linux-amd64.tar.gz

Create a user in Mongo for Monitoring Purpose
You will create a user to track the cluster’s metrics and configure MongoDB authentication for the MongoDB exporter in this section.
Connect to your MongoDB instance with mongo.
$ mongoYou will create an administrator account for your exporter with the cluster monitor role. Switch to the admin database:
> use admin
Create an administrator account for your exporter with the cluster monitor role.
db.createUser({user: "mongo_monitoring",pwd: "temp123",roles: [{ role: "clusterMonitor", db: "admin" },{ role: "read", db: "local" }]})You should see the following message:
db.createUser({user: “mongo_monitoring”,pwd: “temp123”,roles: [{ role: “clusterMonitor”, db: “admin” },{ role: “read”, db: “local” }]})

After creating the user, exit the MongoDB shell:

Set your MongoDB URI environment variable, according to the changes that you made before.
$ export MONGODB_URI=mongodb://<USER>:<PASSWORD>@localhost:27017
export MONGODB_URI=mongodb://mongo_monitoring:temp123@localhost:27017
You set the MONGODB_URI to specify the mongodb instance that uses the authentication credentials you set earlier (the test user and testing password). 27017 is the default port for a mongodb instance. When you set the environment variable, it takes precedence over the profile stored in the configuration file.
You established a MongoDB user in this section with the clusterMonitor role, which helps to monitor the cluster metrics. Next, we’ll configure the MongoDB exporter to run as a service.
Creating a service for MongoDB Exporter
Now that MongoDB Exporter has been successfully downloaded, let’s construct a system service so that it may run on a specific port and expose metrics on this particular port.
Create a new mongod_exporter service file under systemd.
sudo vi /lib/systemd/system/mongod_exporter.service[Unit]
Description=Prometheus MongoDB Exporter
After=network.target
[Service]
Type=simple
Restart=always
ExecStart=/opt/mongodb_exporter/mongodb_exporter --mongodb.uri=mongodb://mongo_monitoring:temp123@localhost:27017
[Install]
WantedBy=multi-user.target
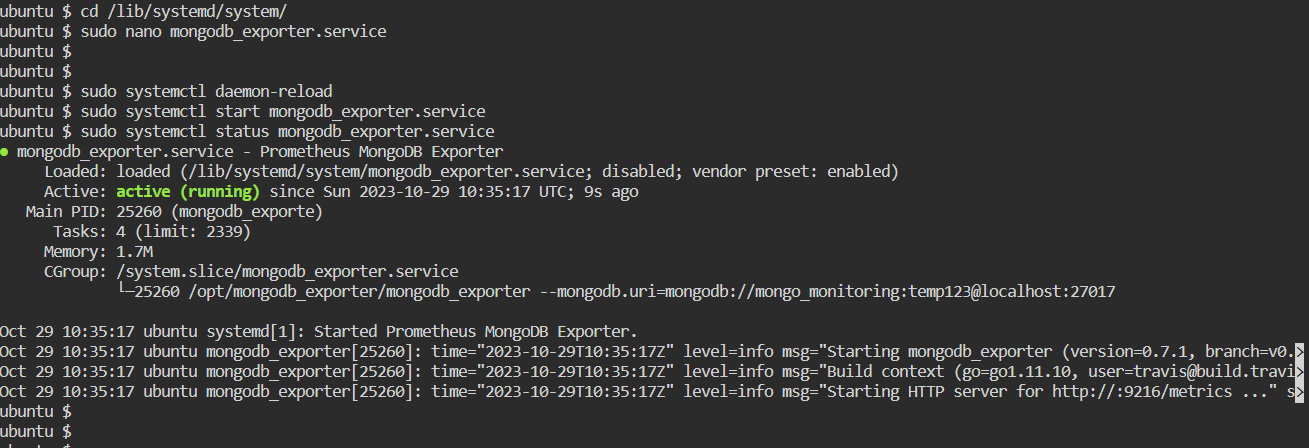
Let me just remind you that the port 9216 is used by Percona’s MongoDB exporter.
Since we made a new unit file, we must restart the systemd daemon, start the service, and tell it to always run at the time of reboot:
sudo systemctl daemon-reload
sudo systemctl enable mongodb_exporter.service
sudo systemctl start mongodb_exporter.service
sudo systemctl status mongodb_exporter.service
To ensure that everything is working correctly, run a simple curl command on the port 9216.
sudo curl http://localhost:9216/metrics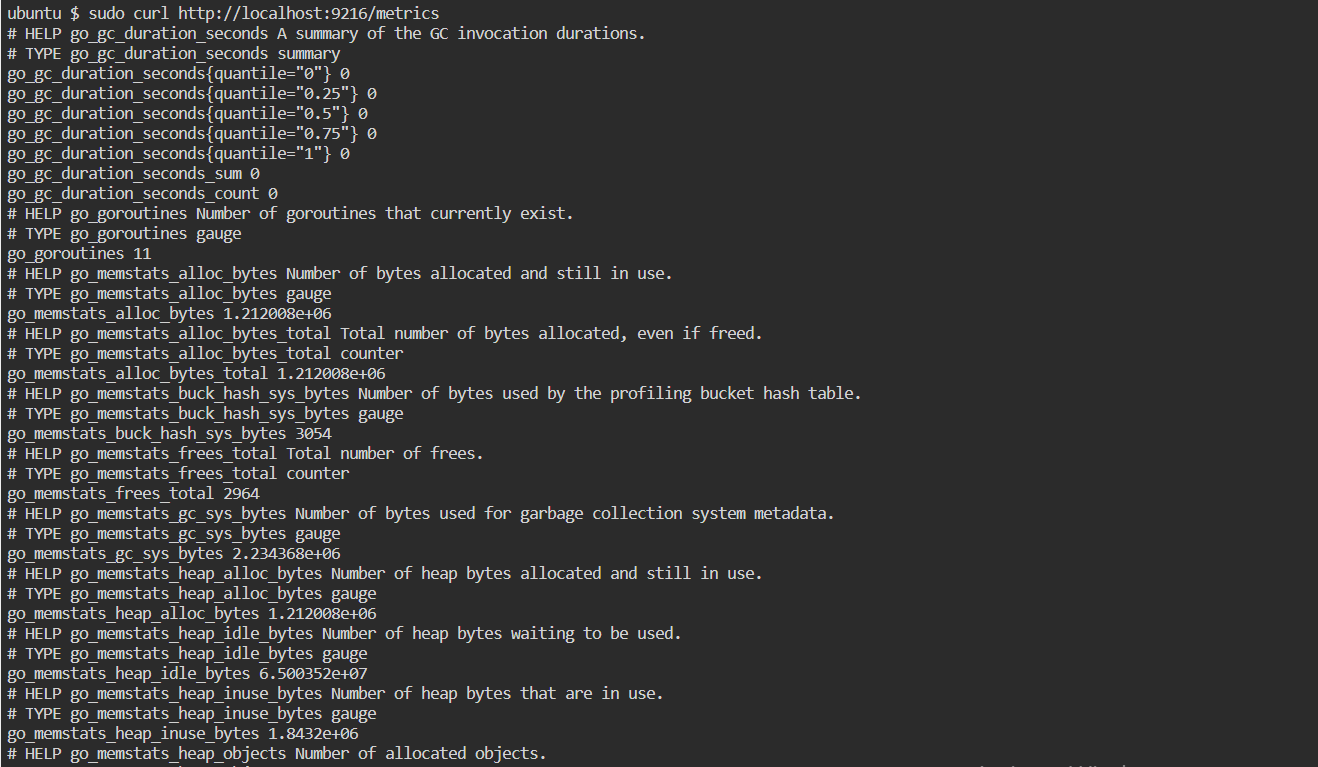
The output confirms that the MongoDB exporter is collecting metrics, such as the mongodb version, metrics-document, and the connections details.
You configured the MongoDB exporter as a service and gathered MongoDB metrics in this section. The exporter will then be set up as a Prometheus target.
Configuring Prometheus to Scrape Metrics from the MongoDB Exporter
Setting up Prometheus to scrape metrics from the MongoDB Exporter is the next step. The MongoDB Exporter endpoint can be added to the Prometheus configuration file to do this. Add the following task definition to the Prometheus configuration file (prometheus.yml) by opening it.
sudo vi /etc/prometheus/prometheus.ymlUnder the ‘scrape_config’ line, add a new job_name: ‘node_exporter’ by copy-pasting the configuration below.
- job_name: 'mongodb_exporter'
  scrape_interval: 5s
  static_configs:
  - targets: ['<MONGODB_IP>:9216']
Save and close your file.
After adding the target, restart Prometheus:
sudo systemctl restart prometheusNavigate to http://localhost:9090/targets to verify that Prometheus is scraping your newly added exporter.

Constructing a Grafana MongoDB Dashboard
We are going to use dashboards built by Percona in order to monitor our MongoDB instance on Grafana.
Percona provides multiple existing dashboards such as:
- MongoDB Overview;
- MongoDB ReplSet;
- MongoDB RocksDB;
- MongoDB WiredTiger;
- MongoDB MMAPv1
- MongoDB InMemory
In Grafana, dashboards come as JSON files. When you create a dashboard, you can export it in this format and share it with the world.
Percona provides dozens of dashboards on its Github repository.
In this case, we are going to download the MongoDB Overview dashboard file.
Run a simple wget command to get the JSON file.
You can create a dedicated dashboards folder in your /etc/grafana folder to store your downloaded dashboards.
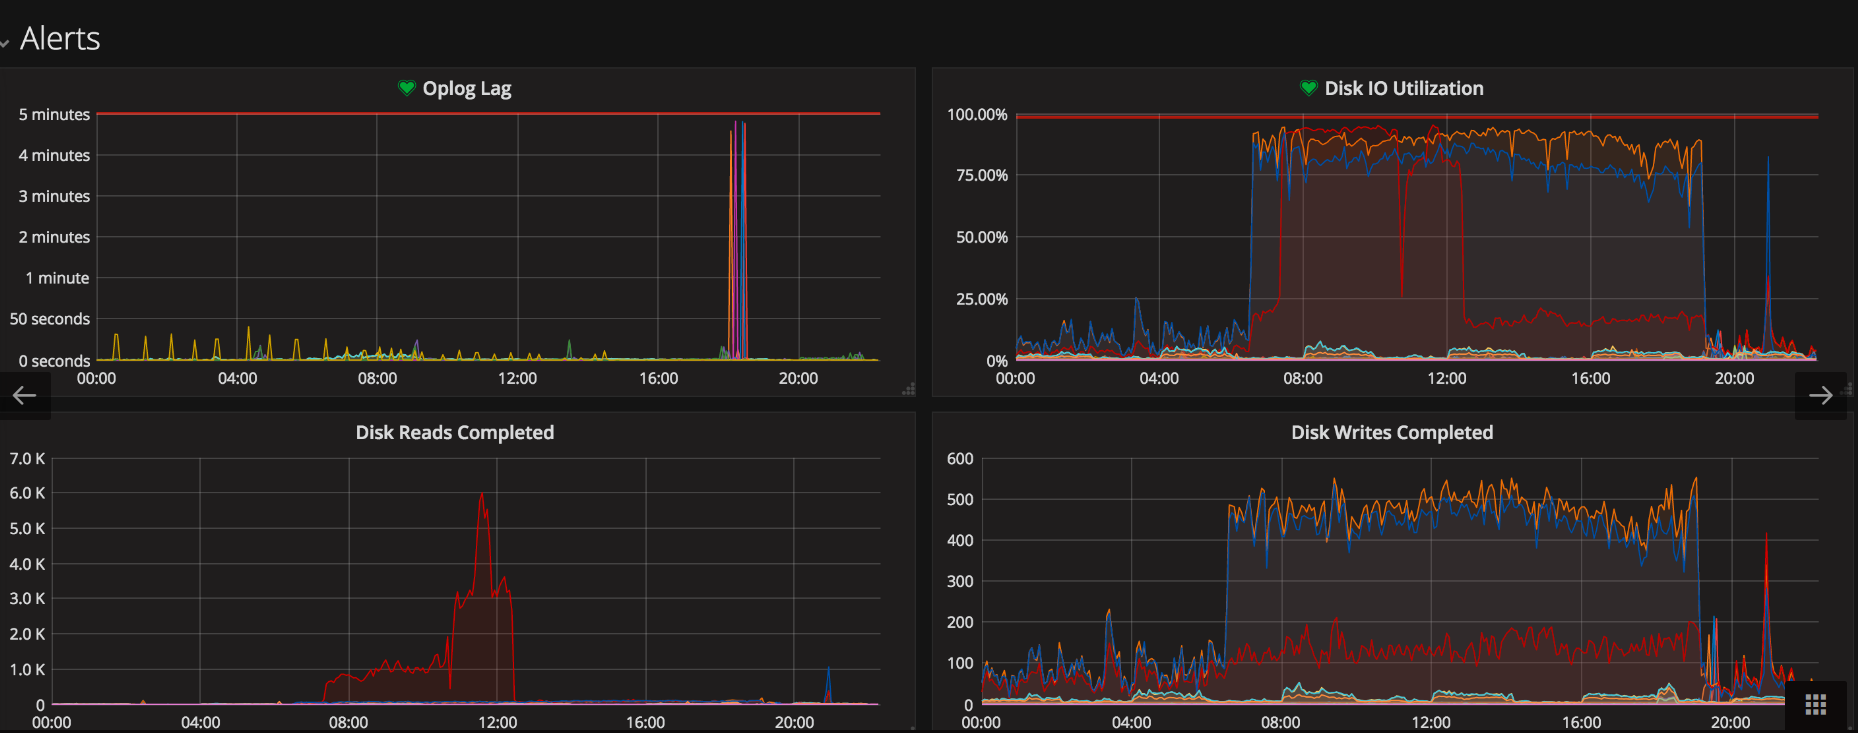
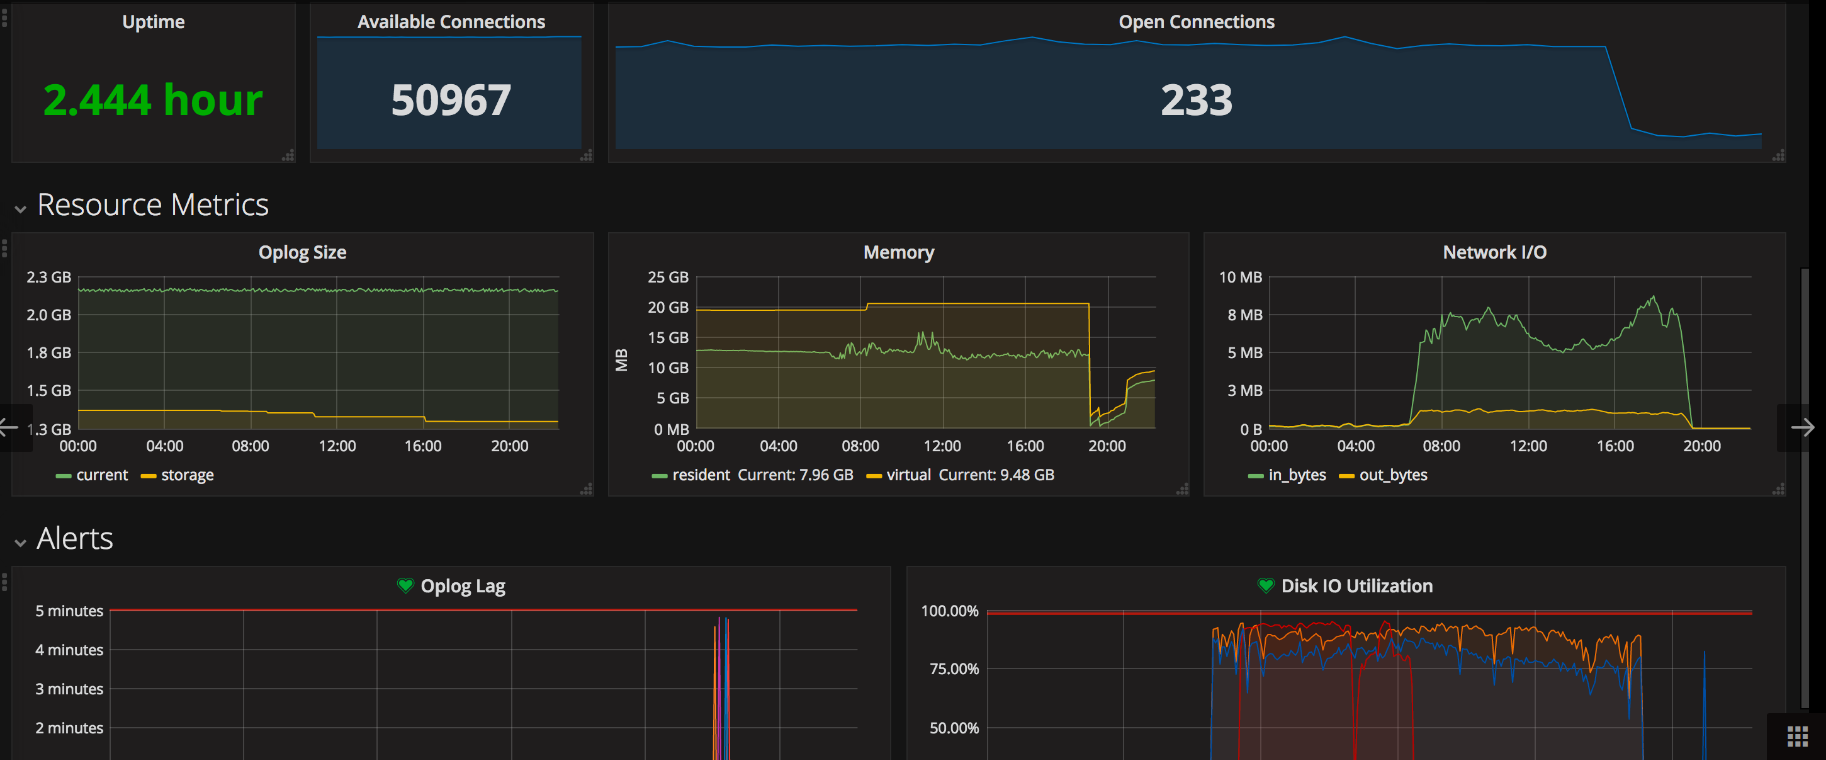
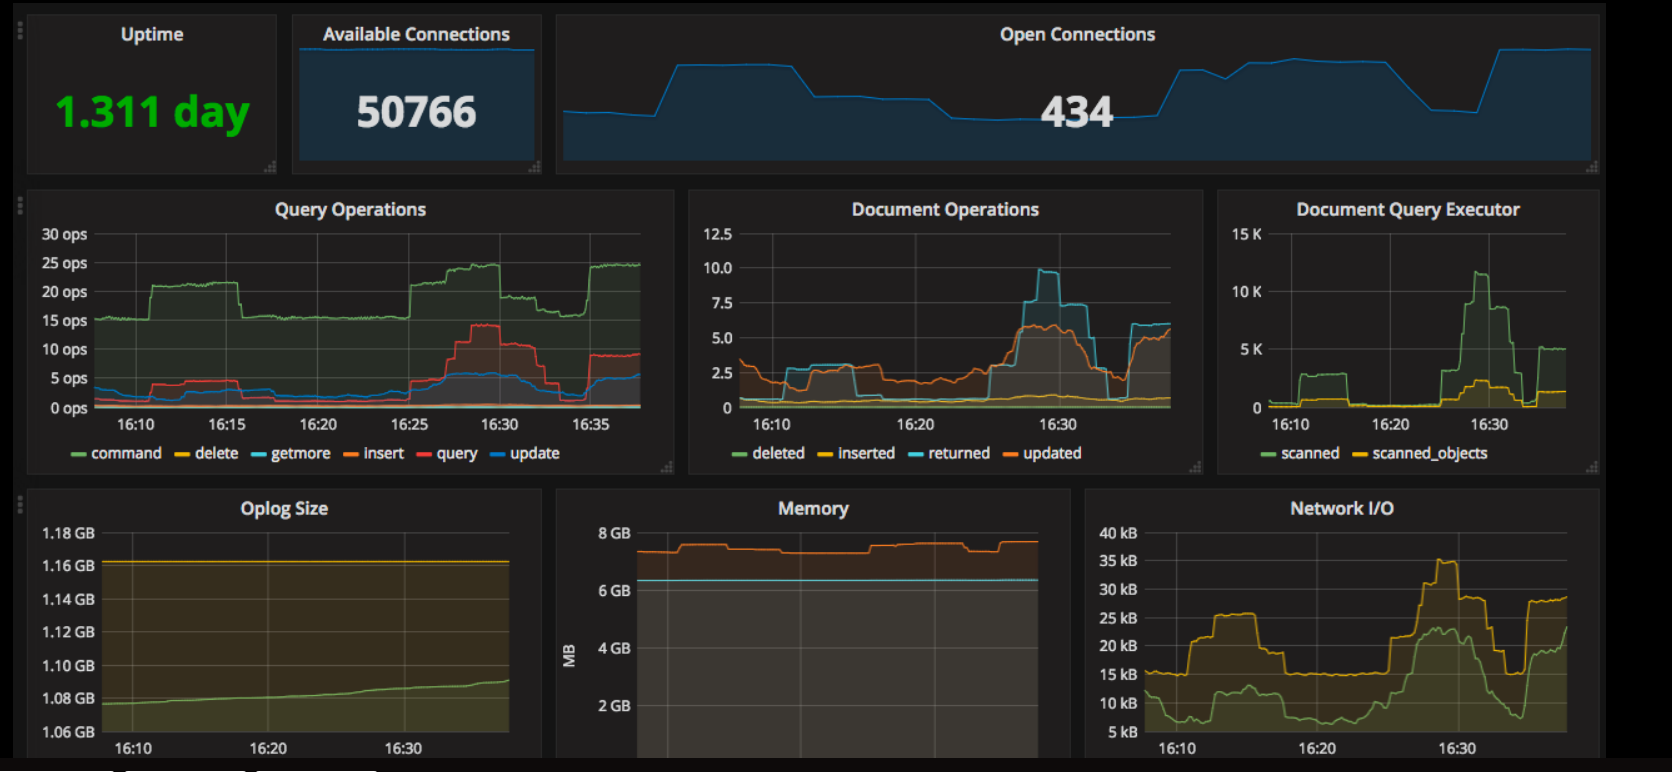
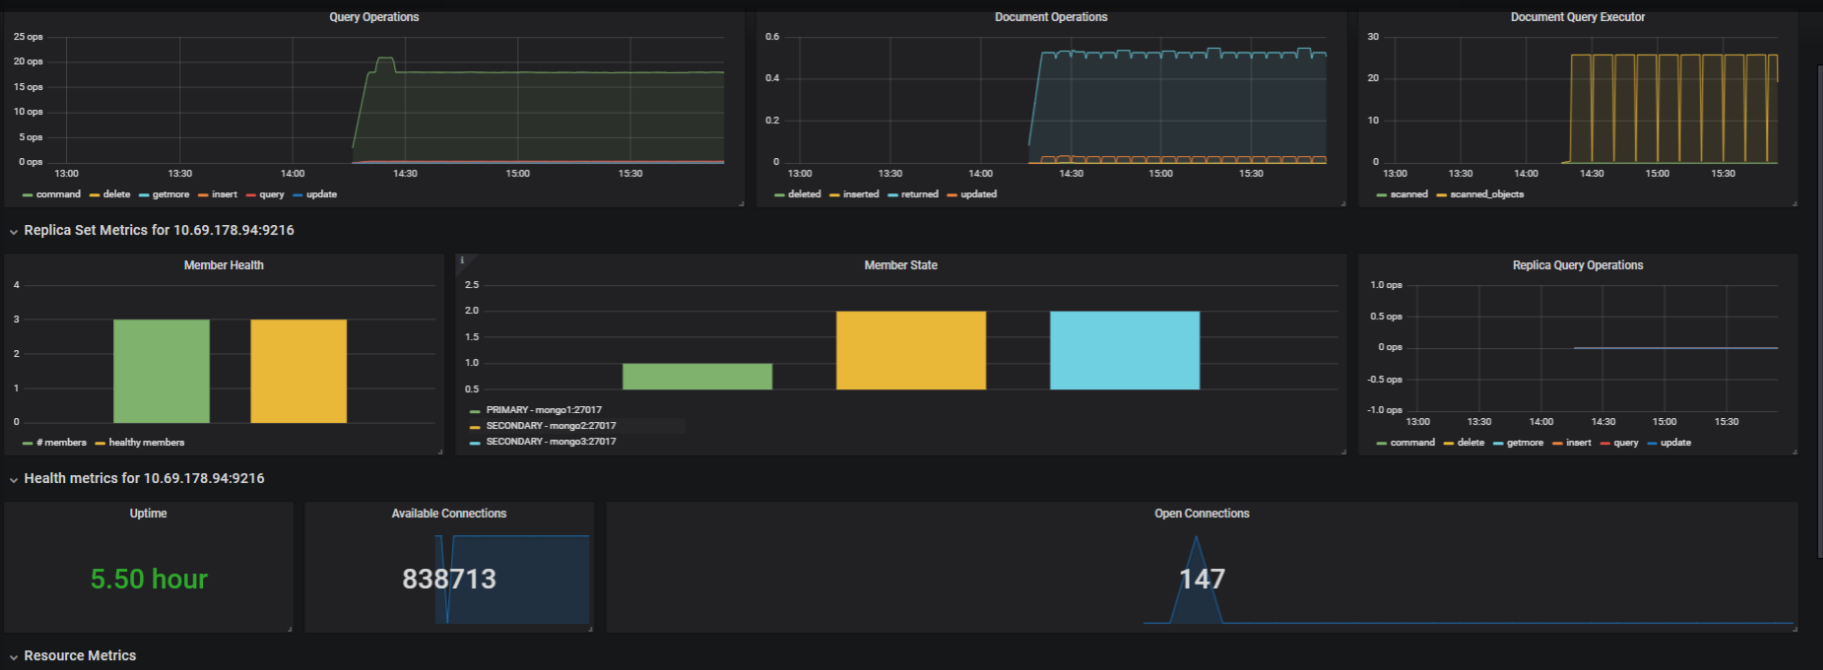
By following the steps in this guide, you can set up MongoDB Monitoring in Prometheus for your Databases.
👍 Please share this article if you found it helpful.
Please feel free to share your ideas for improvement with us in the Comment Section.
🤞 Stay tuned for future posts.
Feel free to contact us for any more conversations regarding Cloud Computing, DevOps, etc.
🚩 Our Recent Posts
- How to mute the alerts for a particular time in Alert Manager?
- How to Monitor your Kubernetes Cluster using Prometheus Easily – Beginners Guide
- How to setup and monitor Endpoints using Blackbox Exporter in Prometheus using simple Steps?
- How to setup a monitoring for TCP Endpoints using Blackbox Exporter in easy steps?
- How to Set Up Federate Jobs in Prometheus: A Simple Guide to Understanding Federate Jobs
- What is Prometheus? How to setup a Prometheus in easy steps?
- How to setup Node Exporter and Easily use it to monitor your Virtual Machine?
- How to monitor your SQL Databases using Prometheus in simple steps?
I’m a DevOps Engineer with 3 years of experience, passionate about building scalable and automated infrastructure. I write about Kubernetes, cloud automation, cost optimization, and DevOps tooling, aiming to simplify complex concepts with real-world insights. Outside of work, I enjoy exploring new DevOps tools, reading tech blogs, and play badminton.
Subscribe to our Newsletter
Please susbscribe
