Kubernetes cluster (K8s) has become a top container orchestration tool in today’s quick-paced and dynamic world of containerized applications. As distributed applications get more complex, maintaining your Kubernetes cluster’s stability and performance becomes essential. The open-source monitoring and alerting toolkit Prometheus is one of the most effective tools in this area.
In this article, we’ll look at the value of keeping an eye on your Kubernetes cluster, the main Prometheus capabilities, and step-by-step directions for configuring Prometheus to successfully monitor your K8s environment.
Almost, more than 80k companies around the globe has shifted to Kubernetes due to improve scaling, high stability and better performance.
Google, AWS & Azure which are known to be one of the biggest players in the world of technology offers managed service for K8s on their cloud-platform names as GKE, EKS & AKS respectively.
“Kubernetes has the opportunity to be the new cloud platform. The amount of innovation that’s going to come from being able to standardize on Kubernetes as a platform is incredibly exciting — more exciting than anything I’ve seen in the last 10 years of working on the cloud.“
But have you ever wondered how these systems can be monitored to ensure 24×7 availability 🤔
The answer to the above question is using Prometheus alerts.
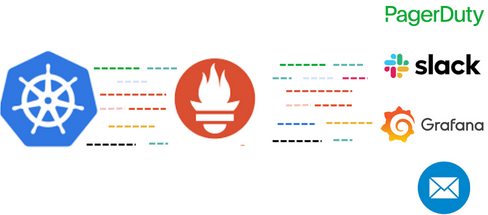
Why should You Monitor Your Kubernetes Cluster?
Finding out about the health, resource usage, and performance of your Kubernetes cluster requires constant monitoring. Without adequate monitoring, it is difficult to identify and resolve problems like performance bottlenecks, resource conflicts, and potential service failures. Effective monitoring has a number of advantages, including:
- Proactive Issue Identification: You may stop possible incidents before they have an impact on your applications or users by quickly identifying anomalous behavior or resource saturation.
- Opportunities for Optimization: By identifying inefficient areas with the use of monitoring, you can better utilize resources and cut expenditures.
- Capacity Planning: You can grow your cluster as necessary by evaluating previous data to determine your future resource needs.
- Performance tuning: Monitoring enables you to optimize the performance of your infrastructure and apps.
Prometheus is an open-source monitoring and alerting toolkit widely used in the Kubernetes ecosystem to monitor containerized applications and infrastructure. As Kubernetes environments grow in complexity, the need to maintain visibility into the health and performance of the cluster becomes crucial. In this blog post, we will explore how to set up Prometheus to monitor a Kubernetes cluster, gather metrics, and create valuable insights into the cluster’s behavior.
1. Understanding Prometheus:
Prometheus is a time-series database and monitoring system that collects metrics from various targets, stores them, and allows querying and alerting based on the gathered data. It follows a pull-based model where it scrapes metrics from endpoints/ports exposed by different services or systems, including Kubernetes components.
2. Architecture of Prometheus:
The main elements of the Prometheus architecture include:
Prometheus Server: The main element that is responsible for gathering and archiving measurements, searching time-series data, and producing alerts.
Exporters: Exporters are just like helping agents which are in charge of exposing metrics from various services or components in a Prometheus-friendly format. There are numerous exporters for Kubernetes, including Node Exporter, and service-level exporters such as MongoDB, Elasticsearch exporters, etc., and kube-state-metrics, among others.
Alertmanager: The element that helps in managing and issuing alerts in accordance with previously established rules entered by the user.
3. Installing and setting up Prometheus
Installing Prometheus monitoring in Kubernetes using Helm charts is a straightforward and efficient way to get started with monitoring your cluster. Helm simplifies the deployment process by providing a package manager for Kubernetes applications. Here’s a step-by-step guide to installing Prometheus monitoring using Helm charts:Steps:
Step 1: Add Prometheus Helm Chart Repository
Add the official Prometheus Helm chart repository to Helm on your local machine:
helm repo add prometheus-community https://prometheus-community.github.io/helm-charts
helm repo update
Step 2: Create a namespace for monitoring in which monitoring-related setup will be there.
kubectl create namespace monitoring-prometheusStep 3: You can customize the Prometheus installation by creating a values file with your desired configurations. Copy the default values.yaml from the Helm chart repository and modify it as needed. For instance, you can change the retention period, alerting rules, etc.
helm show values prometheus-community/prometheus > prometheus-values.yamlStep 4: Install Prometheus
helm install prometheus prometheus-community/prometheus -n monitoring-prometheus -f prometheus-values.yamlStep 5: Verify the Installation
kubectl get pods -n monitoring-prometheusHow to use a federate job to enable Monitoring?
Select a Prometheus instance (we’ll call it “Prometheus Central”) to serve as the main monitoring server. In order to gather statistics from other Prometheus servers, we will enable federation on this instance.
Edit Prometheus Central’s prometheus.yaml configuration file and include the following federate configuration:
global:
  scrape_interval: 15s

federation:
  refresh_interval: 1m  # Adjust the refresh interval as per your needs

rule_files:
  # Add your alerting and recording rules if needed.

scrape_configs:
  - job_name: 'federate'
    scrape_interval: 15s
    honor_labels: true
    metrics_path: '/federate'
    params:
      'match[]':
        - '{job=~"prometheus|node-exporter|kube-state-metrics"}'  # Add your target jobs to be federated
    static_configs:
      - targets:
        - '<K8s prometheus-cluster1>:9090'  # Replace with the address of the Prometheus server in cluster 1
        - '<K8s prometheus-cluster2>:9090'  # Replace with the address of the Prometheus server in cluster 2
        # Add more targets for other clusters if needed
In the above, we’ve created a new scrape configuration with the task name “federate.” This job collects statistics from the target Prometheus servers listed in the static_configs sections/federate endpoint. Based on the job names you want to federate, the targets are filtered in the params section.
Step 1: Restart Prometheus Central:
Restart the Prometheus server to implement the configuration changes after making modifications to Prometheus Central’s prometheus.yml configuration file.
sytemctl restart prometheus.serviceStep 2: Check Federate Configuration
Once Prometheus Central is operational and configured for federation, you may enter its web interface and go to the "Status" > "Targets" tab. The targets are displayed as "federate" jobs should be the ones you selected in the static_configssection.
Step 3: Querying Federated Metrics:
Federated metrics can now be queried in Prometheus just like any other metric when a federation has been set up. PromQL queries, for instance, can be used to get data from both the main Prometheus instance and federated Prometheus instances.

This was my little attempt to share the process of Monitor your Kubernetes Cluster using Prometheus Easily – Beginners Guide with you all.
👍 Please share this article if you found it helpful.
Please feel free to share your ideas for improvement with us in the Comment Section.
🤞 Stay tuned for future posts.
Feel free to contact us for any more conversations regarding Cloud Computing, DevOps, etc.
Our Recent Posts
- How to configure AlertManager? Improve observability of your system easily – Beginners guide
- What is Observability, Monitoring and alerting? How to avoid downtime of the System?
- How to mute the alerts for a particular time in Alert Manager?
I’m a DevOps Engineer with 3 years of experience, passionate about building scalable and automated infrastructure. I write about Kubernetes, cloud automation, cost optimization, and DevOps tooling, aiming to simplify complex concepts with real-world insights. Outside of work, I enjoy exploring new DevOps tools, reading tech blogs, and play badminton.
Subscribe to our Newsletter
Please susbscribe

