Prometheus is a widely adopted open-source monitoring system known for its powerful query language and time-series database, often complemented by M3DB for scalable and efficient storage solutions used by many organizations. However, as organizations scale, they often encounter challenges and issues with their monitoring systems along with long-term storage and query performance. This is where M3DB comes into a role, offering a highly scalable, efficient, and long-lasting remote storage solution.
You can check out another blog on how to setup Prometheus here.
You can think it as a type of database that can replace the TSBD used in Prometheus. This can become a choice for companies that are looking to scale their Prometheus-based monitoring systems as it can be used as a remote Storage along with prometheus and is fully compatible with the PromQL Query used in Prometheus.
M3DB is originally a time-series based database which is developed by Uber.
Today, the M3 project is maintained by open-source contributors all around the world and is used by some of the world’s largest organizations.
It is designed for fast write throughput, low query latency, and optimal storage consumption.
When M3DB is used as a remote storage backend for Prometheus, it smoothly connects with the remote read/write APIs, allowing for scalable and long-term storage of monitoring data.
To know more about different remote write compatible backends, you can check this.
This project is completely written in Go.
Let’s talk about the components of M3DB in detail.
Components of M3DB:
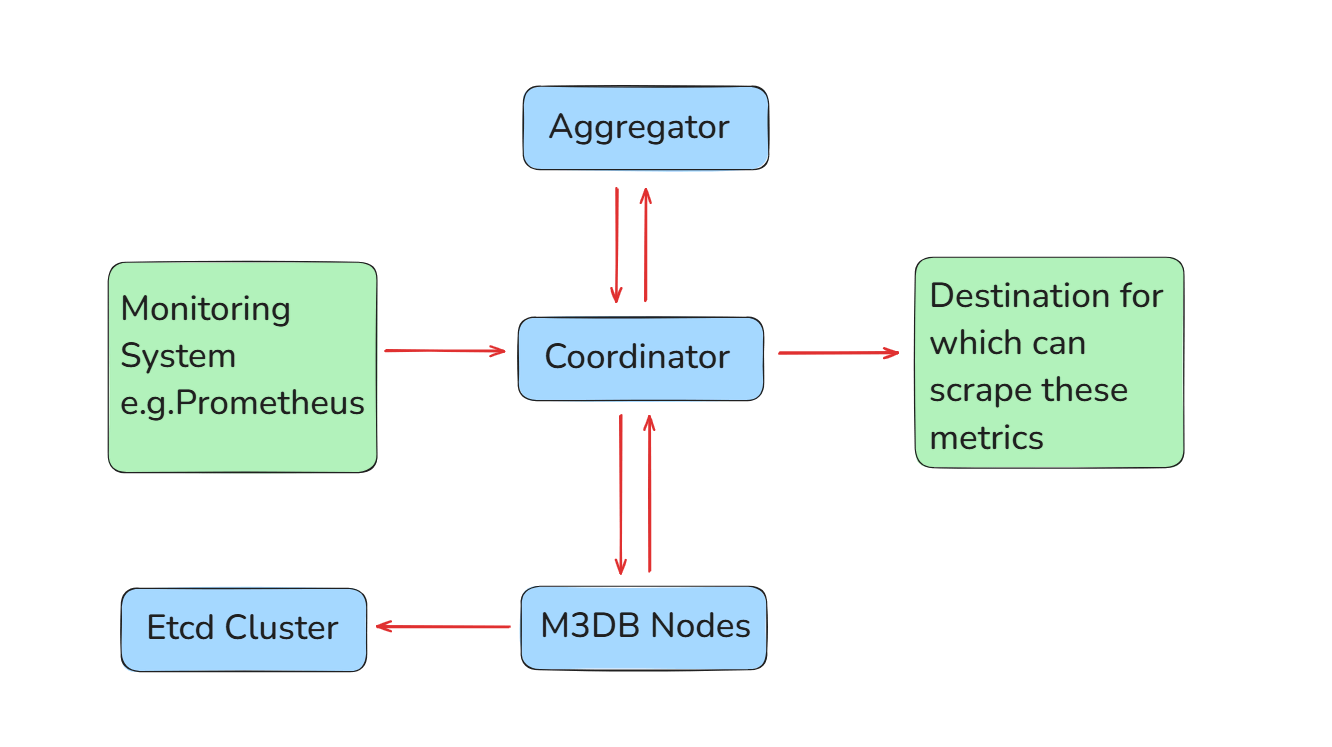
The main components of M3DB’s architecture are:
1. Coordinator
This is the main component of the M3DB as the name suggests.
The M3Coordinator serves as the entry point for queries and writes. Its responsibilities include:
- Interacting with Prometheus using remote read/write APIs.
- Distributing write operations among M3DB nodes.
- Querying metrics in M3DB and aggregating the results.
- Perform Downsampling and retention of metrics
The M3 Coordinator also does downsampling, ad hoc retention, and metric aggregation with retention and rollup criteria. This enables us to apply specific retention and aggregations to subsets of metrics on the fly, using rules stored in etcd, which is contained in the binary of an M3DB seed node.
The M3 Coordinator service coordinates reads and writes between upstream and downstream systems, such as Prometheus and M3DB.
For Example, if you have a metrics emittor as a Prometheus which is emitting and scraping metrics via the targets register, then you can use send those metrics to coordinator and then this coordinator acn further help in storing these metrics in the underlying M3DB Nodes which is in a cluster state.
It also supports management via the REST APIs for setting up and configuring various elements of M3.
In general, the coordinator serves as a bridge for reading and writing various metrics formats, as well as a management layer for M3.
M3DB, by default, includes the M3 Coordinator, which is accessible on port 7201.
remote_write:
  - url: "http://<m3coordinator>:7201/api/v1/prom/remote/write"
remote_read:
  - url: "http://<m3coordinator>:7201/api/v1/prom/remote/read"
However, for production deployments, it is advised to deploy this as a dedicated service so that you can scale the write coordination function independently to the database nodes[Storage Nodes] as an isolated application separate from the M3DB database role while maintaining the cost-efficiency as well.
2. Storage Nodes[M3DB Nodes]
M3DB nodes form the core of the storage layer. Each node:
- Stores a subset of the time-series data.
- Handles replication by synchronizing with other nodes.
- Manages data shards to distribute load across the cluster.
- Cluster management built on top of etcd
- Time precision in terms of Retention is configurable from seconds to nanoseconds, and it can switch precision with any write.
M3DB nodes are just like the clustered Databases like MongoDB Cluster, SQL Cluster, Redis Cluster, etc.
They are used for writing the metrics-related data via the coordinator.
Namespace-Specific Retention: The most beautiful part of M3DB Cluster Setup is that we can configure the Retention individually at the namespace level. Each namespace can have its own distinct retention settings.
Retention Period Flexibility: You can create multiple namespaces with different retention periods tailored to specific use cases, such as storing metrics for short-term or long-term analysis.
They can be deployed separately from the coordinator in production-based systems as mentioned above as they can be scaled independently.
3. Aggregator
m3aggregator is a distributed system written in Go. It performs metrics streaming aggregation on ingested time series data before storing it in m3db Nodes[Storage Nodes].
The goal is to reduce the volume of time series data stored (particularly for longer retention periods), which is accomplished by lowering cardinality and/or datapoint resolution.
For Example, if we are collecting and scraping metrics in kubernetes cluster, now imagine the numbe rof metrics exposes in a prduction grade cluster but it is not necessary that all the metrics being exposed are used by us, hence we may not wish to store them unencessarily. So for this, we can drop such metrics before it get stores in m3db Nodes. Hence for such purpose we can make use of Aggregator.
However please note that M3aggregator's communication protocol is m3msg only. This means that M3aggregator can take input data from M3Coordinator only as it only supports m3msg format.
4. Etcd Cluster:
M3DB includes support for running embedded etcd (known as seed nodes), which is useful for testing and development, but it is not recommended for using it in production [The above setup does not include seed nodes as this blog is all about deploying the m3db cluster in production].
M3 and etcd both are complex distributed systems, and trying to run them within the same binary such as seed nodes is difficult and unsafe for production workflows.
Instead, we can build an external etcd cluster that is separate from the M3 stack to make activities such as node additions, removals, and replacements easier along with scaling cost-efficient.
Basically, this is an external etcd and won’t affect our master plane etcd so it is safe to use.
Also, this works similarly like the master plane etcd, the way K8s cluster-related information is stored in the etcd, here also for storing m3db cluster-related info, we make use of etcd.
Architecture of M3DB
That’s all for this blog!!
However, the m3db setup is very complex in itself so we will be publishing all the details in a module manner in our upcoming blogs so Stay Tuned!!!
🚩 Our Recent Posts
- How to Create a Systemd Service in Linux?
- How to keep 99.9% Uptime for application using Montioring & Alerting?
- How to Reduce/Save Costs on Microsoft Azure Log Analytics Workspace: Tips & Best Practices
I’m a DevOps Engineer with 3 years of experience, passionate about building scalable and automated infrastructure. I write about Kubernetes, cloud automation, cost optimization, and DevOps tooling, aiming to simplify complex concepts with real-world insights. Outside of work, I enjoy exploring new DevOps tools, reading tech blogs, and play badminton.
Subscribe to our Newsletter
Please susbscribe
