In this blog, setup Node Exporter, we’ll walk through the process of installing Node Exporter and integrating it with Prometheus for thorough monitoring. The Node Exporter is an agent that collects system metrics and makes them available in a Prometheus-compatible manner.
🔥 It’s crucial to maintain a careful check on your server’s health and performance in the ever changing world of technology.
💀 Having the correct tools available may make all the difference, whether you’re managing a single server or an entire data center.
✅ With the help of Node Exporter and Prometheus, two potent tools that provide you access to information about your server’s internal operations, we’ll explore the world of monitoring in this tech article.

🤔What is Node Exporter?
In Prometheus, Node Exporter is a well-liked open-source exporter that is made to gather and expose different system-level metrics from Linux and Unix systems. These metrics give us important information on the state and functionality of our servers, which makes it simpler to efficiently monitor and manage your infrastructure.
Consider being in charge of a fleet of servers that run the vital business apps. You must make sure that these servers are functioning properly, identify problems before they become critical, and optimize resource utilization. Here, monitoring becomes important.
These metrics include CPU usage, memory consumption, disk I/O, network activity, and much more. Node Exporter packages all this valuable information into a format Prometheus can understand.
✅ Prerequisites
- Basic knowledge of the Linux command-line interface (CLI)
- Ubuntu server with Version > 14.04
- To scrape the metrics, connectivity between the Prometheus server and the end server must be enabled on port 9100.
🔽 (Installing) Setup Node Exporter
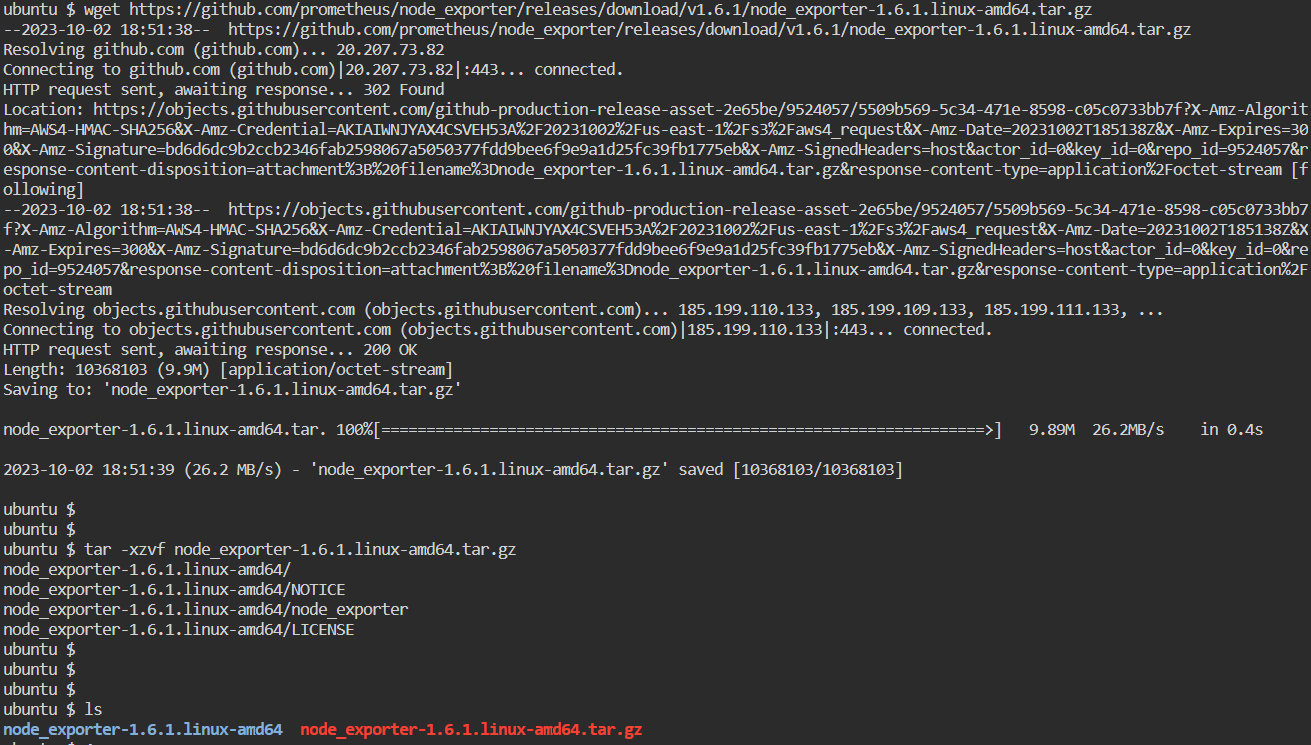
Step 1: Download the latest node exporter package. You should check the Prometheus downloads section for the latest version and update this command to get that package.
To store configuration files and libraries for Node Exporter, we will create a new directory and install Node Exporter in this new directory /opt/node_exporter. Use the commands below to create the directories
Create a directory:
mkdir /opt/node_exporter
cd /opt/node_exporter
Replace X.Y.Z with the release version you want to download from here.
wget https://github.com/prometheus/node_exporter/releases/download/vX.Y.Z/node_exporter-X.Y.Z.linux-amd64.tar.gz

tar -xzvf node_exporter-X.Y.Z.linux-amd64.tar.gz

mv node_exporter-X.Y.Z.linux-amd64/* .
For example, if you want to download Prometheus version 1.6.1, the command would be:
wget https://github.com/prometheus/node_exporter/releases/download/v1.6.1/node_exporter-1.6.1.linux-amd64.tar.gz

tar -xzvf node_exporter-1.6.1.linux-amd64.tar.gz
mv node_exporter-1.6.1.linux-amd64/* .
🔥 Running Node Exporter as a Service
Now that Node Exporter has been successfully downloaded, let’s construct a system service so that it may run on a specific port and expose metrics on this particular port.
Create a node_exporter service file under systemd.
sudo vi/etc/systemd/system/node_exporter.service[Unit]
Description=Node Exporter
After=network.target
[Service]
User=ubuntu
ExecStart=/opt/node_exporter/node_exporter
[Install]
WantedBy=multi-user.target

In the above code, /opt/node_exporter/node_exporter is the path of the binary downloaded in the above steps.
You can replace this with the path where you have downloaded the Node Exporter binary file.
Since we made a new unit file, we must restart the systemd daemon, start the service, and tell it to always run at the time of reboot:
sudo systemctl daemon-reload
sudo systemctl enable node_exporter.service
sudo systemctl start node_exporter.service
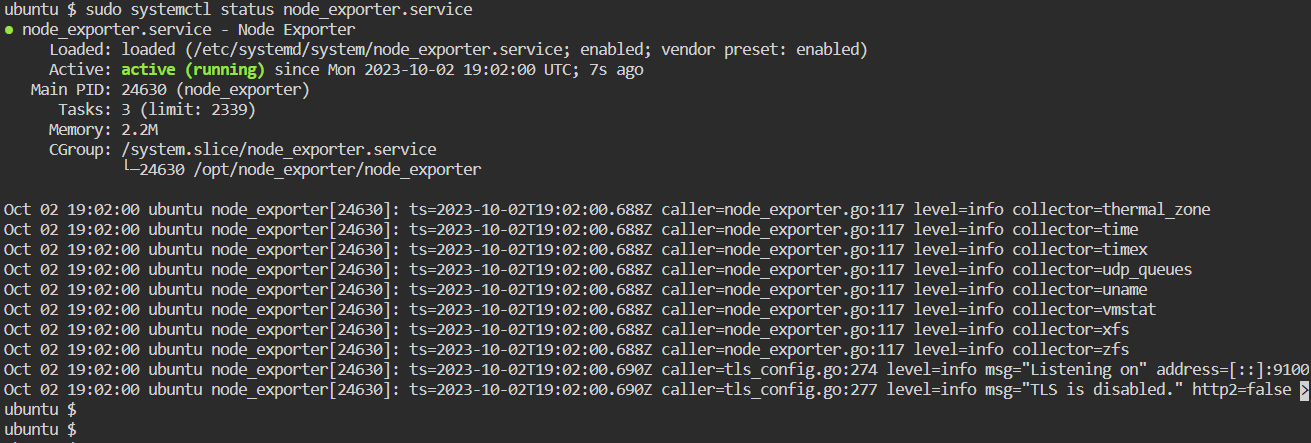
sudo systemctl status node_exporter.service

☲ Add configuration in Prometheus to scrape metrics
Open the Prometheus configuration file (on Prometheus Server), generally prometheus.yml and add your server IP/hostname with port, then restart the Prometheus process.
sudo vi /etc/prometheus/prometheus.ymlUnder the ‘scrape_config’ line, add a new job_name: ‘node_exporter’ one by copy-pasting the configuration below.
scrape_configs:
  - job_name: 'node_exporter'
    static_configs:
      - targets: ['<SERVER-IP>:9100']
Save the file and exit.
Replace <SERVER-IP> with the server IP which you want to monitor.
🌐 Access metrics using cURL Request
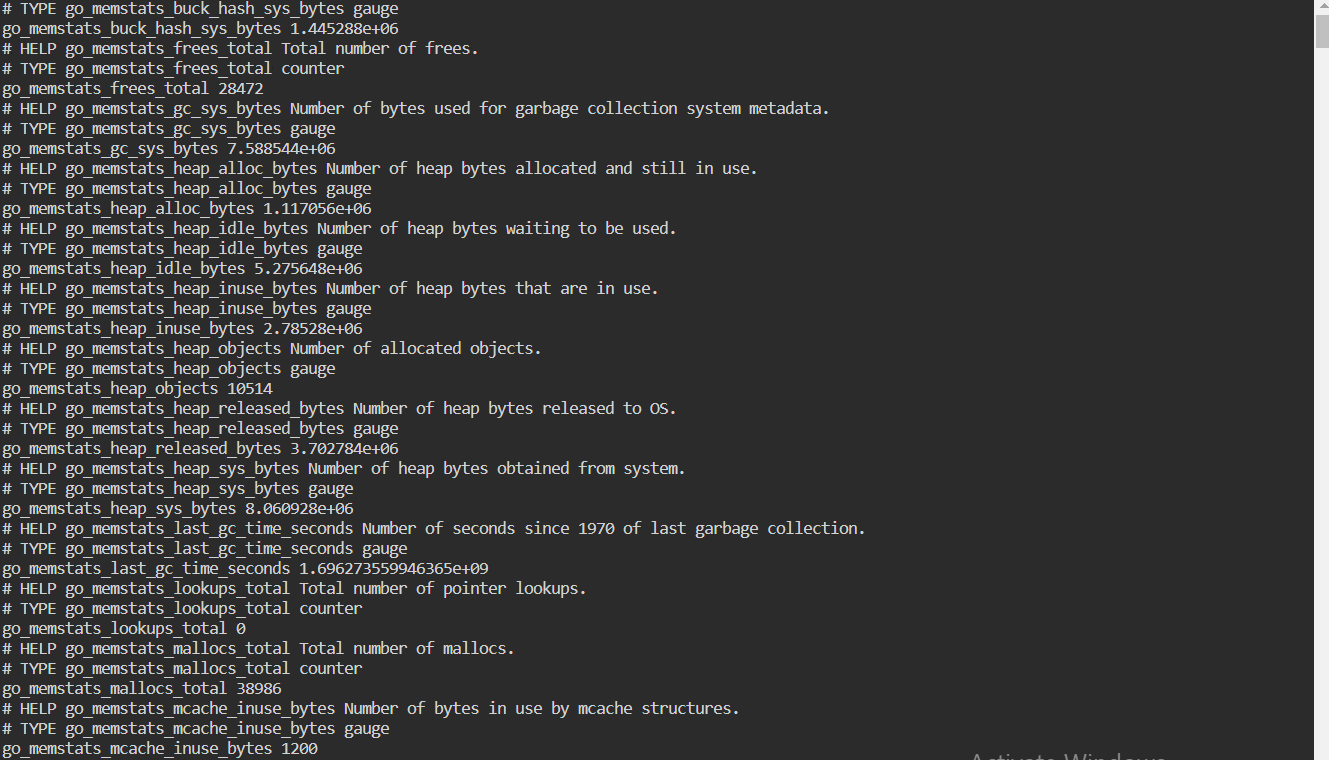
You can check that metrics are being exported when the Node Exporter is installed and functioning by cURLing the /metrics endpoint:
curl http://<SERVER-IP>:9100/metricsYou should see output like this:

This will expose and return all the metrics related to the Virtual Machine like memory, disk, CPU, IOPS, etc.
We can also setup alerts based on different metrics and monitor the VMs and take appropriate actions before it worsens.
This helps in preventing the downtime and also helps in taking faster actions.
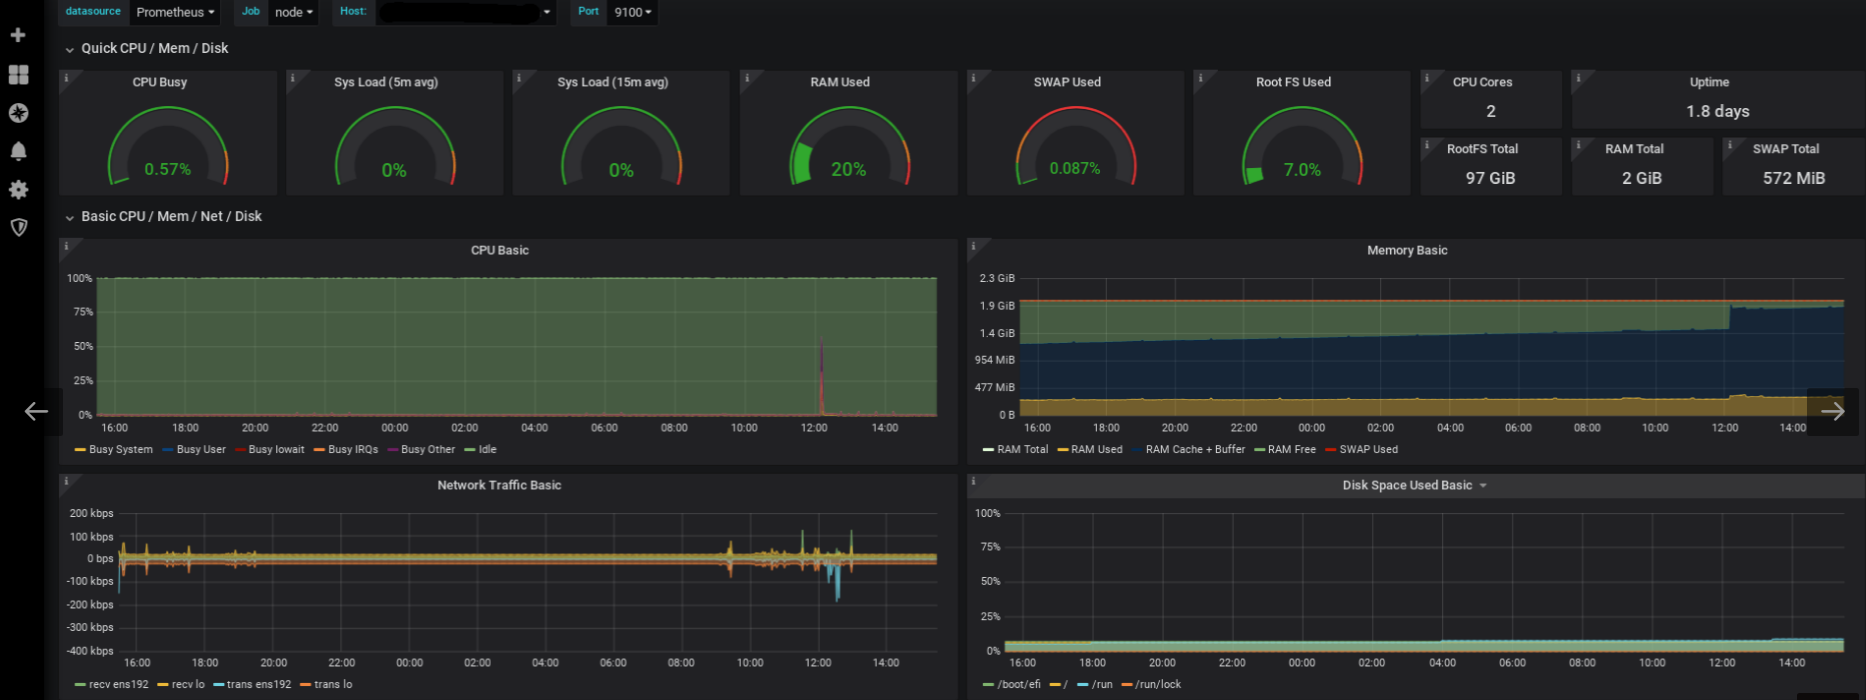
You can also setup a Grafana Dashboard with the help of these metrics from here.


By following the steps in this guide, you can set up Prometheus for your monitoring needs.
👍 Please share this article if you found it helpful.
Please feel free to share your ideas for improvement with us in the Comment Section.
🤞 Stay tuned for future posts.
Feel free to contact us for any more conversations regarding Cloud Computing, DevOps, etc.
🚩 Our Recent Posts
- How to mute the alerts for a particular time in Alert Manager?
- How to Monitor your Kubernetes Cluster using Prometheus Easily – Beginners Guide
- How to setup and monitor Endpoints using Blackbox Exporter in Prometheus using simple Steps?
- How to setup a monitoring for TCP Endpoints using Blackbox Exporter in easy steps?
- How to Set Up Federate Jobs in Prometheus: A Simple Guide to Understanding Federate Jobs
- What is Prometheus? How to setup a Prometheus in easy steps?
I’m a DevOps Engineer with 3 years of experience, passionate about building scalable and automated infrastructure. I write about Kubernetes, cloud automation, cost optimization, and DevOps tooling, aiming to simplify complex concepts with real-world insights. Outside of work, I enjoy exploring new DevOps tools, reading tech blogs, and play badminton.
Subscribe to our Newsletter
Please susbscribe


