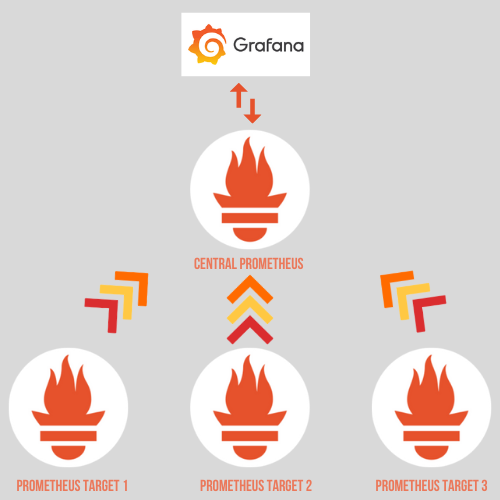
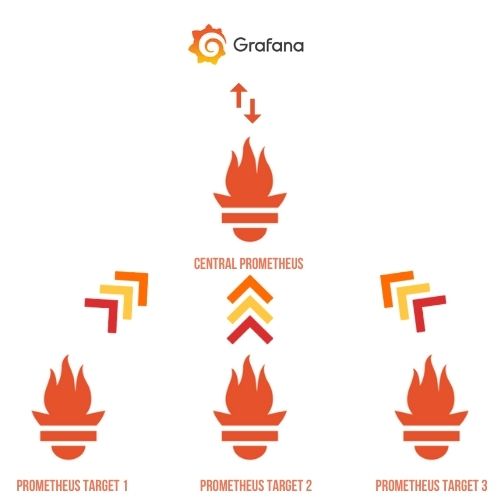
Federate jobs in Prometheus are a feature that allows you to scrape and aggregate data from multiple Prometheus instances or other HTTP endpoints. This is particularly useful in scenarios where you have multiple Prometheus servers running in different environments, and you want to centralize and query their data in a single location.

Understanding Federate Jobs
You are probably already aware of Prometheus’ potent querying and alerting features if you use it to monitor your infrastructure.
💭 But What happens, though, if you want to scrape information from different Prometheus instances?
💡 This is where federate jobs come into play. Federated jobs are a great way to achieve consistency.
Let’s explore what federate jobs are and how to set them up in Prometheus.

What are Federate Jobs?
Federate jobs in Prometheus are a feature that allows you to scrape and aggregate data from multiple Prometheus instances or other HTTP endpoints. This is particularly useful in scenarios where you have multiple Prometheus servers running in different environments, and you want to centralize and query their data in a single location.
In a federated job, the source Prometheus server fetches data from a target Prometheus server or another HTTP endpoint, such as an exporter or a remote storage system. The source Prometheus server then stores this data locally in the times series-based database and exposes it as a time series that can be queried and used for alerting, visualization, and analysis.
Federate jobs are implemented using the federate service discovery mechanism in Prometheus. This mechanism enables one Prometheus server to scrape data from another Prometheus server or any HTTP endpoint that exposes Prometheus-compatible metrics.
Use Cases for Federate Jobs
Federate jobs offer several use cases and benefits:
- Centralized Monitoring: You can centralize your monitoring and alerting, giving you a uniform view of your infrastructure, by federating data from many Prometheus instances.
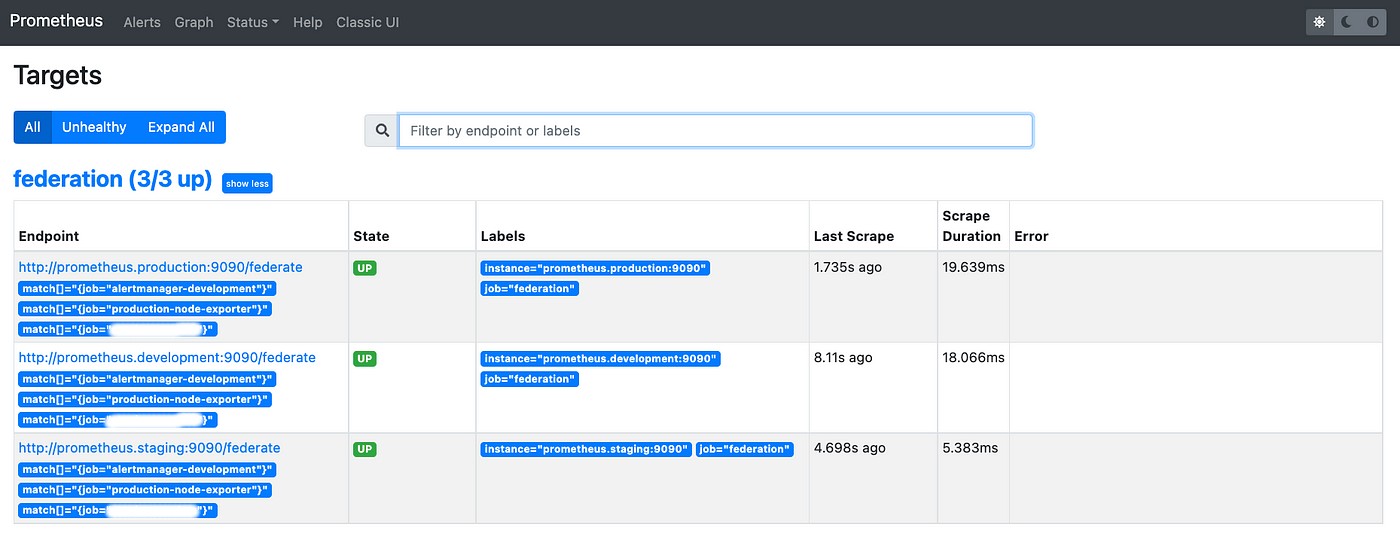
- Cross-Environment Monitoring: If your Prometheus servers are located in various environments (such as development, staging, and production), you may utilize federated tasks to collect data from each one of them, which will make cross-environment monitoring easier.
- Integration with Third-Party Systems: You can utilize federate tasks to scrape metrics from third-party systems, like cloud providers, databases, and application services, that expose Prometheus metrics through HTTP.
- Historical Data Collection: Federate jobs can be used to collect historical data from a remote Prometheus instance, allowing you to perform long-term analysis and reporting.
Now that we understand the concept of federate jobs, let’s dive into setting up a federate job in Prometheus.
How to set up a federate job in Prometheus?
Setting up a federate job in Prometheus involves the following steps:
1. Configure the Source Prometheus Server
In your source Prometheus server’s configuration (typically prometheus.yml), define a scrape_config section for the federate job.
Specify the target Prometheus server or HTTP endpoint you want to scrape data from. Here’s an example configuration:
scrape_configs:
  - job_name: 'federate'
    honor_labels: true
    metrics_path: '/federate'
    params:
      match[]:
        - '{job=".+."}'
    static_configs:
      - targets:
        - '<target-prometheus>:9090'
Let me break down the key components of this configuration:
| This is a top-level section in the Prometheus configuration file where you define scrape configurations for various jobs or targets. |
| This defines a scrape job with the name ‘federate’. Prometheus scrapes data from endpoints or targets based on the job name. You can provide any custom name here. |
| This option specifies that Prometheus should honor the labels provided by the target when scraping metrics. Labels are key-value pairs that can be attached to metrics to provide additional context. |
| This is the path where Prometheus will make HTTP requests to collect metrics. In this case, it’s set to ‘/federate’. |
params | This section allows you to specify query parameters to filter which metrics are collected. In this case, it’s using the 'match[]' parameter to filter metrics based on the job label. It will scrape metrics for all the jobs as the 'job' label is equal to regex which contains all. |
| This section defines the list of target instances that Prometheus will scrape metrics from. |
| This is the address and port of the target instance where Prometheus will scrape metrics. In this case, it’s 'target-prometheus:9090'. You should replace this with the actual address of the Prometheus server you want to scrape metrics from. |
So, in summary, this configuration sets up a Prometheus scrape job named 'federate' that collects metrics from a target Prometheus server located at 'target-prometheus:9090' and filters metrics for all the 'job' label as it is set to all using regex using the '/federate' endpoint. You would need to make sure that the target Prometheus server is properly configured to expose metrics at the '/federate' endpoint.
It can generate a large amount of data to scrape every metric from every secondary server in a federated network, and it’s entirely likely that not all of this data will be used by the central server. We have a “params” field for this purpose where we can enter expressions to filter the data that will be scraped from the targeted servers. The expressions in this instance match the jobs that each server has defined.
2. Configure the Target Prometheus Server or Endpoint
On the target Prometheus server or endpoint, ensure that it exposes the metrics you want to federate. Prometheus metrics should be available at the metrics_path specified in the source Prometheus configuration. Make sure that CORS (Cross-Origin Resource Sharing) settings allow access from the source Prometheus server.
3. Start Prometheus Servers
Start both the source and target Prometheus servers with their respective configurations. Ensure that they are accessible and can communicate with each other over the network using the telnet.
4. Query Federated Data
Once the federate job is configured and the Prometheus servers are running, you can query the federated data using PromQL (Prometheus Query Language). The federated data is available under the job name you defined in the source Prometheus configuration.
For example, if you federated data from a job named 'federate', you can query it like this:
up{job="federate"}This query fetches the up metric from the federated data.

Federate jobs in Prometheus provide a powerful way to aggregate data from multiple Prometheus instances or other HTTP endpoints, making it easier to centralize monitoring and analyze data across different environments and systems.
By following the steps in this guide, you can set up federate jobs and harness the full potential of Prometheus for your monitoring needs.
👍 Please share this article if you found it helpful.
Please feel free to share your ideas for improvement with us in the Comment Section.
🤞 Stay tuned for future posts.
Feel free to contact us for any more conversations regarding Cloud Computing, DevOps, etc.
Our Recent Posts
- How to configure AlertManager? Improve observability of your system easily – Beginners guide
- What is Observability, Monitoring and alerting? How to avoid downtime of the System?
- How to mute the alerts for a particular time in Alert Manager?
- How to Monitor your Kubernetes Cluster using Prometheus Easily – Beginners Guide
- How to setup and monitor Endpoints using Blackbox Exporter in Prometheus using simple Steps?
- How to setup a monitoring for TCP Endpoints using Blackbox Exporter in easy steps?
I’m a DevOps Engineer with 3 years of experience, passionate about building scalable and automated infrastructure. I write about Kubernetes, cloud automation, cost optimization, and DevOps tooling, aiming to simplify complex concepts with real-world insights. Outside of work, I enjoy exploring new DevOps tools, reading tech blogs, and play badminton.
Subscribe to our Newsletter
Please susbscribe


