The ability to analyze and monitor your SQL databases is essential for preserving optimal performance and guaranteeing data integrity in today’s data-driven world.
🎃 Databases are the most critical component of our systems. Want to understand why, let’s understand with the help of an example.
Consider an e-commerce platform during a holiday sale. The High Traffic received during this peak time can lead to slow database queries, impacting user experience.
With Prometheus, you can detect and optimize slow queries to ensure smooth shopping for users.
💀 Downtime can be costly. Prometheus helps you set up alerts to detect database outages or performance degradation.

When joined together, the powerful open-source tools Prometheus and Grafana provide an excellent solution for tracking and visualizing many parts of your system.
Let’s Get Started! (Monitor your SQL Databases)
Monitoring solutions like Prometheus store historical data, which is invaluable for identifying long-term trends, predicting future needs, and understanding seasonal patterns.
To check more details regarding Prometheus, do check it out here.
✅ Follow this step-by-step tutorial to activate SQL exporter for monitoring SQL databases with Prometheus and Grafana on a Linux-based server.
Prerequisites
Make sure you have the following conditions met before beginning:
- A Linux-based System(Ubuntu is used here).
- Grafana and Prometheus are already set up and installed. If not you can setup using this blog
- Depending on your database system, a SQL exporter like mysqld_exporter for MySQL databases is needed.
(Installing) Setup SQL Exporter
Download the most recent SQL Exporter package.
To check all available versions, you should update this command and look for the most recent version in the Prometheus downloads section.
We will make a new directory called /opt/node_exporter and install Node Exporter there to store configuration files and libraries. Create the directories using the commands shown below.
Establish a directory:
mkdir /opt/mysql_exporter
cd /opt/mysql_exporter
On MySQL/MariaDB servers, including master and slave servers, we need to install this exporter.
You might need to visit the Prometheus MySQL exporter releases page for the most recent version, and then export it.
The release version you want to download from here should be replaced with X.Y.Z.
wget https://github.com/prometheus/mysqld_exporter/releases/download/vX.Y.Z/mysql_exporter-X.Y.Z.linux-amd64.tar.gz

tar -xzvf mysqld_exporter-X.Y.Z.linux-amd64.tar.gz

mv mysqld_exporter-X.Y.Z.linux-amd64/* .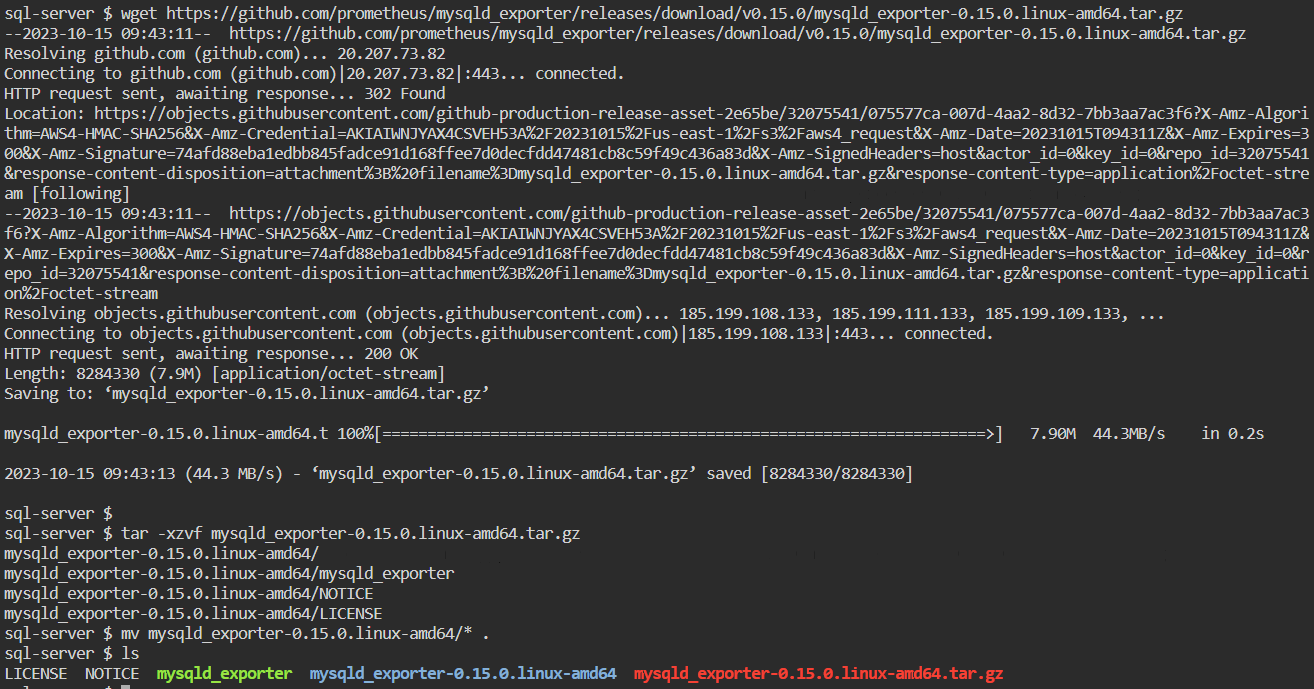
Confirm installation by checking the version of mysqld_exporter
mysqld_exporter --version
Create a database user for the Prometheus exporter.
Login to SQL using the root/admin credentials.
mysql -u root -pThe user should have PROCESS, SELECT, REPLICATION CLIENT grants:
CREATE USER 'mysqld_exporter'@'localhost' IDENTIFIED BY 'XXXXXXXX' WITH MAX_USER_CONNECTIONS 3;

GRANT PROCESS, REPLICATION CLIENT, SELECT ON *.* TO 'mysqld_exporter'@'localhost';

EXIT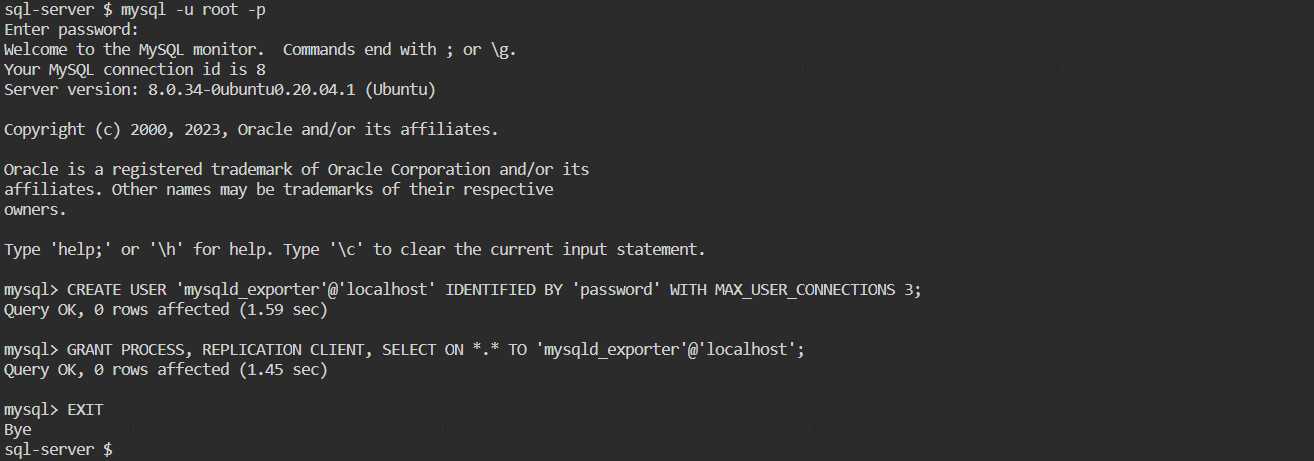
If your database design is Master-Slave, only create users on the Master servers.
Configure the SQL Credentials
Create the database credentials file by performing the following command:
sudo vim /opt/mysql_exporter/.mysqld_exporter.cnfInclude the correct username and password of the user created above.
[client]
user=mysqld_exporter
password=<Password>
Provide necessary permissions to the file containing sensitive data.
sudo chown root:root /opt/mysql_exporter/.mysqld_exporter.cnf
Create a Service file
Now that SQL Exporter has been successfully downloaded, let’s construct a system service so that it may run on a specific port and expose metrics on this particular port.
Create a new mysqld_exporter service file under systemd.
sudo vi /etc/systemd/system/mysqld_exporter.service[Unit]
Description=Prometheus MySQL Exporter
After=network.target
[Service]
Type=simple
Restart=always
ExecStart=/opt/mysql_exporter/mysqld_exporter \
--config.my-cnf /opt/mysql_exporter/.mysqld_exporter.cnf \
--collect.global_status \
--web.listen-address=0.0.0.0:9304
[Install]
WantedBy=multi-user.target
You can also replace the port 9304 with the port on which you want to expose metrics.
A few flags, which can be used while defining the above service with their details are:
| Name | Description |
|---|---|
| mysqld.address | Hostname and port used for connecting to MySQL server, format: host:port. (default: locahost:3306) |
| mysqld.username | Username to be used for connecting to MySQL Server |
| config.my-cnf | Path to .my.cnf file to read MySQL credentials from. (default: ~/.my.cnf) |
| log.level | Logging verbosity (default: info) |
| exporter.lock_wait_timeout | Set a lock_wait_timeout (in seconds) on the connection to avoid long metadata locking. (default: 2) |
| exporter.log_slow_filter | Add a log_slow_filter to avoid slow query logging of scrapes. NOTE: Not supported by Oracle MySQL. |
| tls.insecure-skip-verify | Ignore tls verification errors. |
| web.config.file | Path to a web configuration file |
| web.listen-address | Address to listen on for web interface and telemetry. |
| web.telemetry-path | Path under which to expose metrics. |
| version | Print the version information. |
Since we made a new unit file, we must restart the systemd daemon, start the service, and tell it to always run at the time of reboot:
sudo systemctl daemon-reload
sudo systemctl enable node_exporter.service
sudo systemctl start node_exporter.service
sudo systemctl status node_exporter.service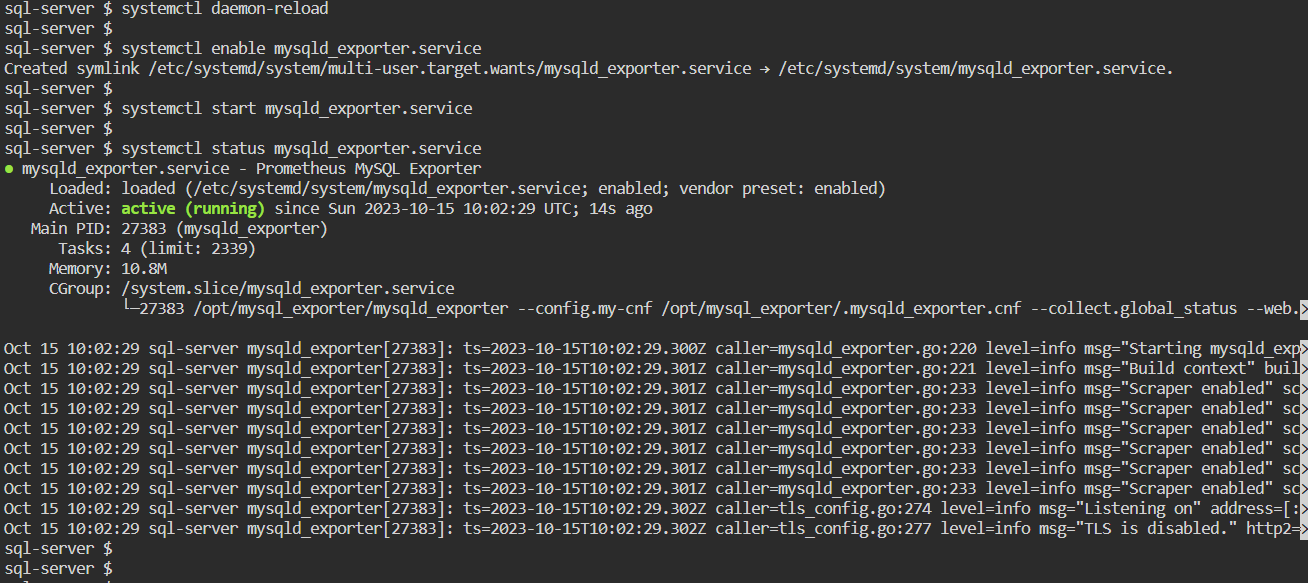
Set up the MySQL endpoint so that Prometheus Server may scrape it
Open the Prometheus configuration file (on the Prometheus Server), generally prometheus.yml and add your server IP/hostname with the port, then restart the Prometheus process.
sudo vi /etc/prometheus/prometheus.ymlUnder the ‘scrape_config’ line, add a new job_name: ‘node_exporter’ by copy-pasting the configuration below.
scrape_configs:
  - job_name: 'sql_exporter'
    static_configs:
      - targets: ['<SERVER-IP>:9304']
Or if there are multiple targets and you want to keep the target files separate, we can create a file and add a target to it.
And Add the path of a file in the above config for reference.
scrape_configs:
  - job_name: 'sql_exporter'
    file_sd_configs:
      - files:
        - '/etc/prometheus/database_targets.yml'
    relabel_configs:
      - source_labels: [__address__]
        regex: (.*)
        replacement: $1
        target_label: instance
In this example, we have a job named 'sql_exporter' that reads targets from the specified file, applies a relabeling configuration to set the ‘instance’ label based on the target address, and scrapes data from these targets.
You can check that metrics are being exported when the SQL Exporter is installed and functioning by cURLing the /metrics endpoint:
curl http://<SERVER-IP>:9304/metricsYou should see output like this:
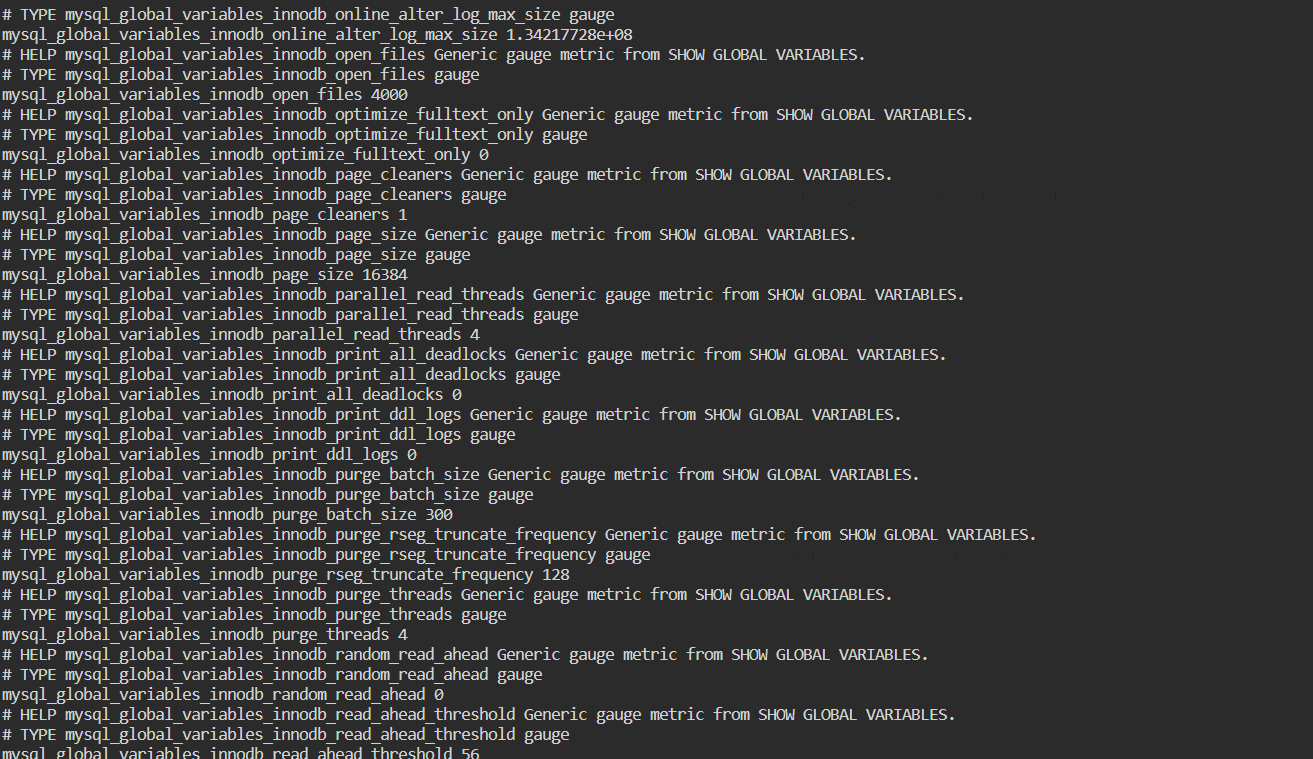
You can also customize the metrics path. For Example, the above metrics are exposed at /metrics path, to expose it to another path, you can use the variable name web.telemetry-path and define a custom path using this in the service file.
To setup/export Grafana Dashboard, there are couple of Grafana Dashboards available for SQL metrics.
We can directly use them by exporting without creating these from scratch.
- https://grafana.com/grafana/dashboards/409-sql-server-telegraf/
- https://grafana.com/grafana/dashboards/9386-sql-servers/
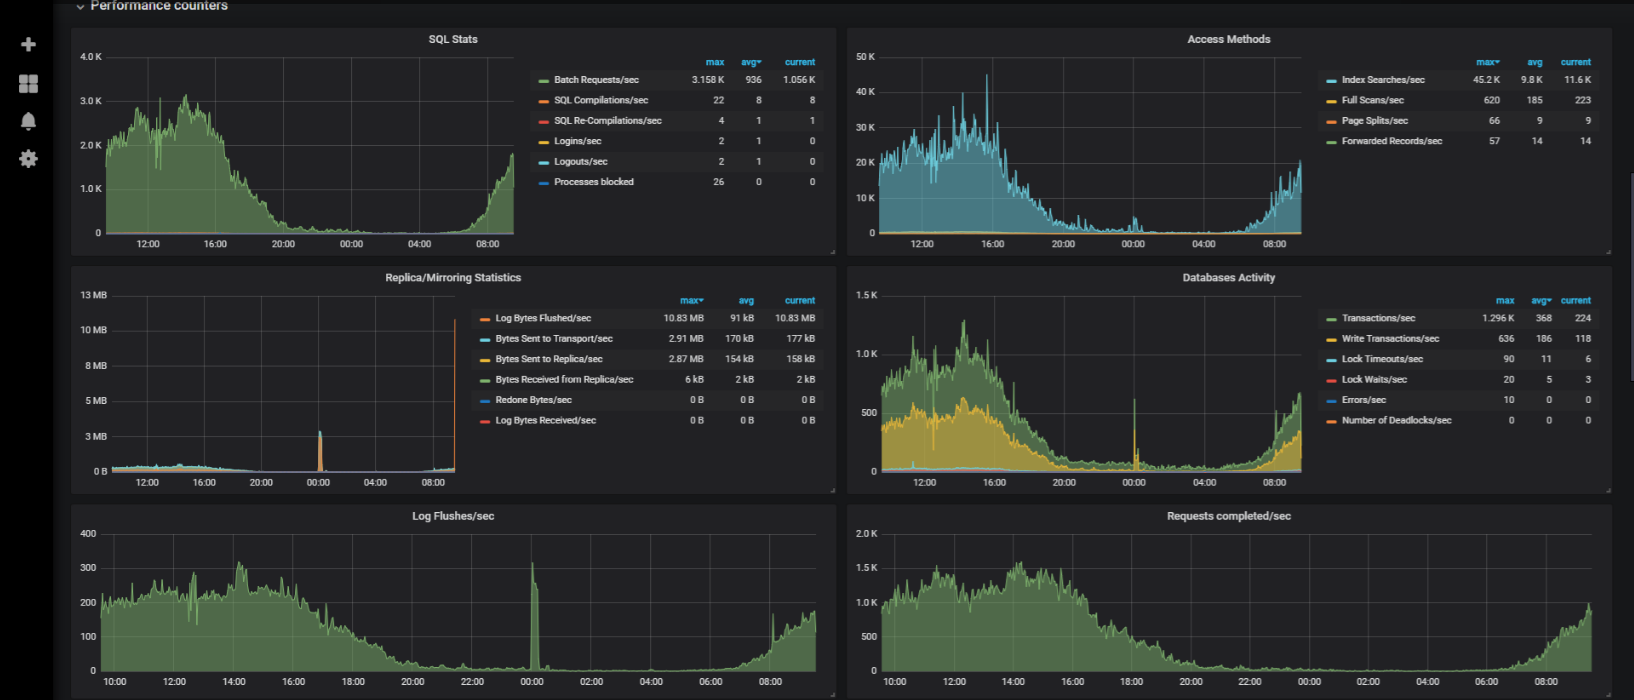
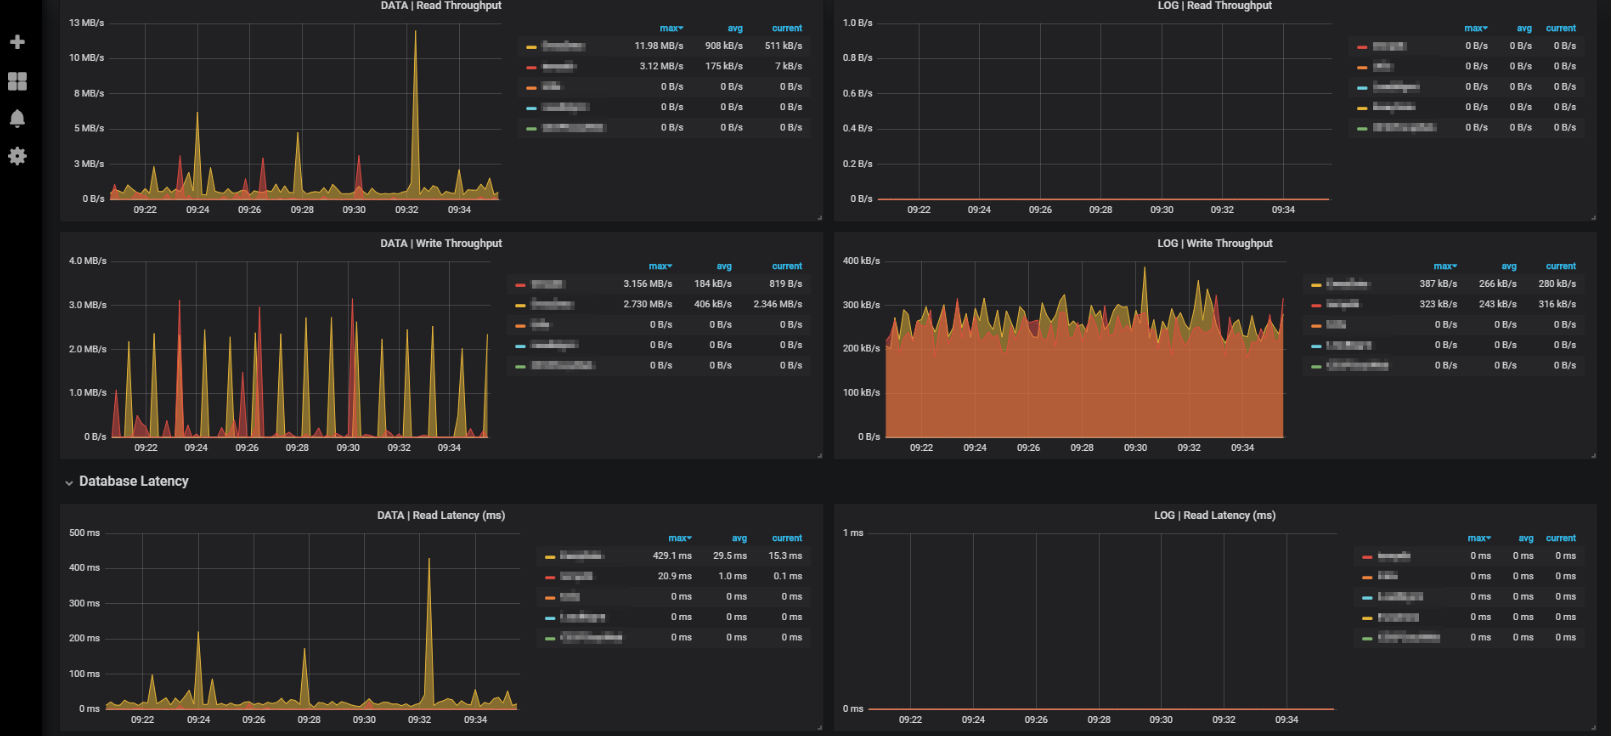
By following the steps in this guide, you can set up Prometheus for your monitoring needs.
👍 Please share this article if you found it helpful.
Please feel free to share your ideas for improvement with us in the Comment Section.
🤞 Stay tuned for future posts.
Feel free to contact us for any more conversations regarding Cloud Computing, DevOps, etc.
🚩 Our Recent Posts
- How to mute the alerts for a particular time in Alert Manager?
- How to Monitor your Kubernetes Cluster using Prometheus Easily – Beginners Guide
- How to setup and monitor Endpoints using Blackbox Exporter in Prometheus using simple Steps?
- How to setup a monitoring for TCP Endpoints using Blackbox Exporter in easy steps?
- How to Set Up Federate Jobs in Prometheus: A Simple Guide to Understanding Federate Jobs
- What is Prometheus? How to setup a Prometheus in easy steps?
- How to setup Node Exporter and Easily use it to monitor your Virtual Machine?
I’m a DevOps Engineer with 3 years of experience, passionate about building scalable and automated infrastructure. I write about Kubernetes, cloud automation, cost optimization, and DevOps tooling, aiming to simplify complex concepts with real-world insights. Outside of work, I enjoy exploring new DevOps tools, reading tech blogs, and play badminton.
Subscribe to our Newsletter
Please susbscribe


