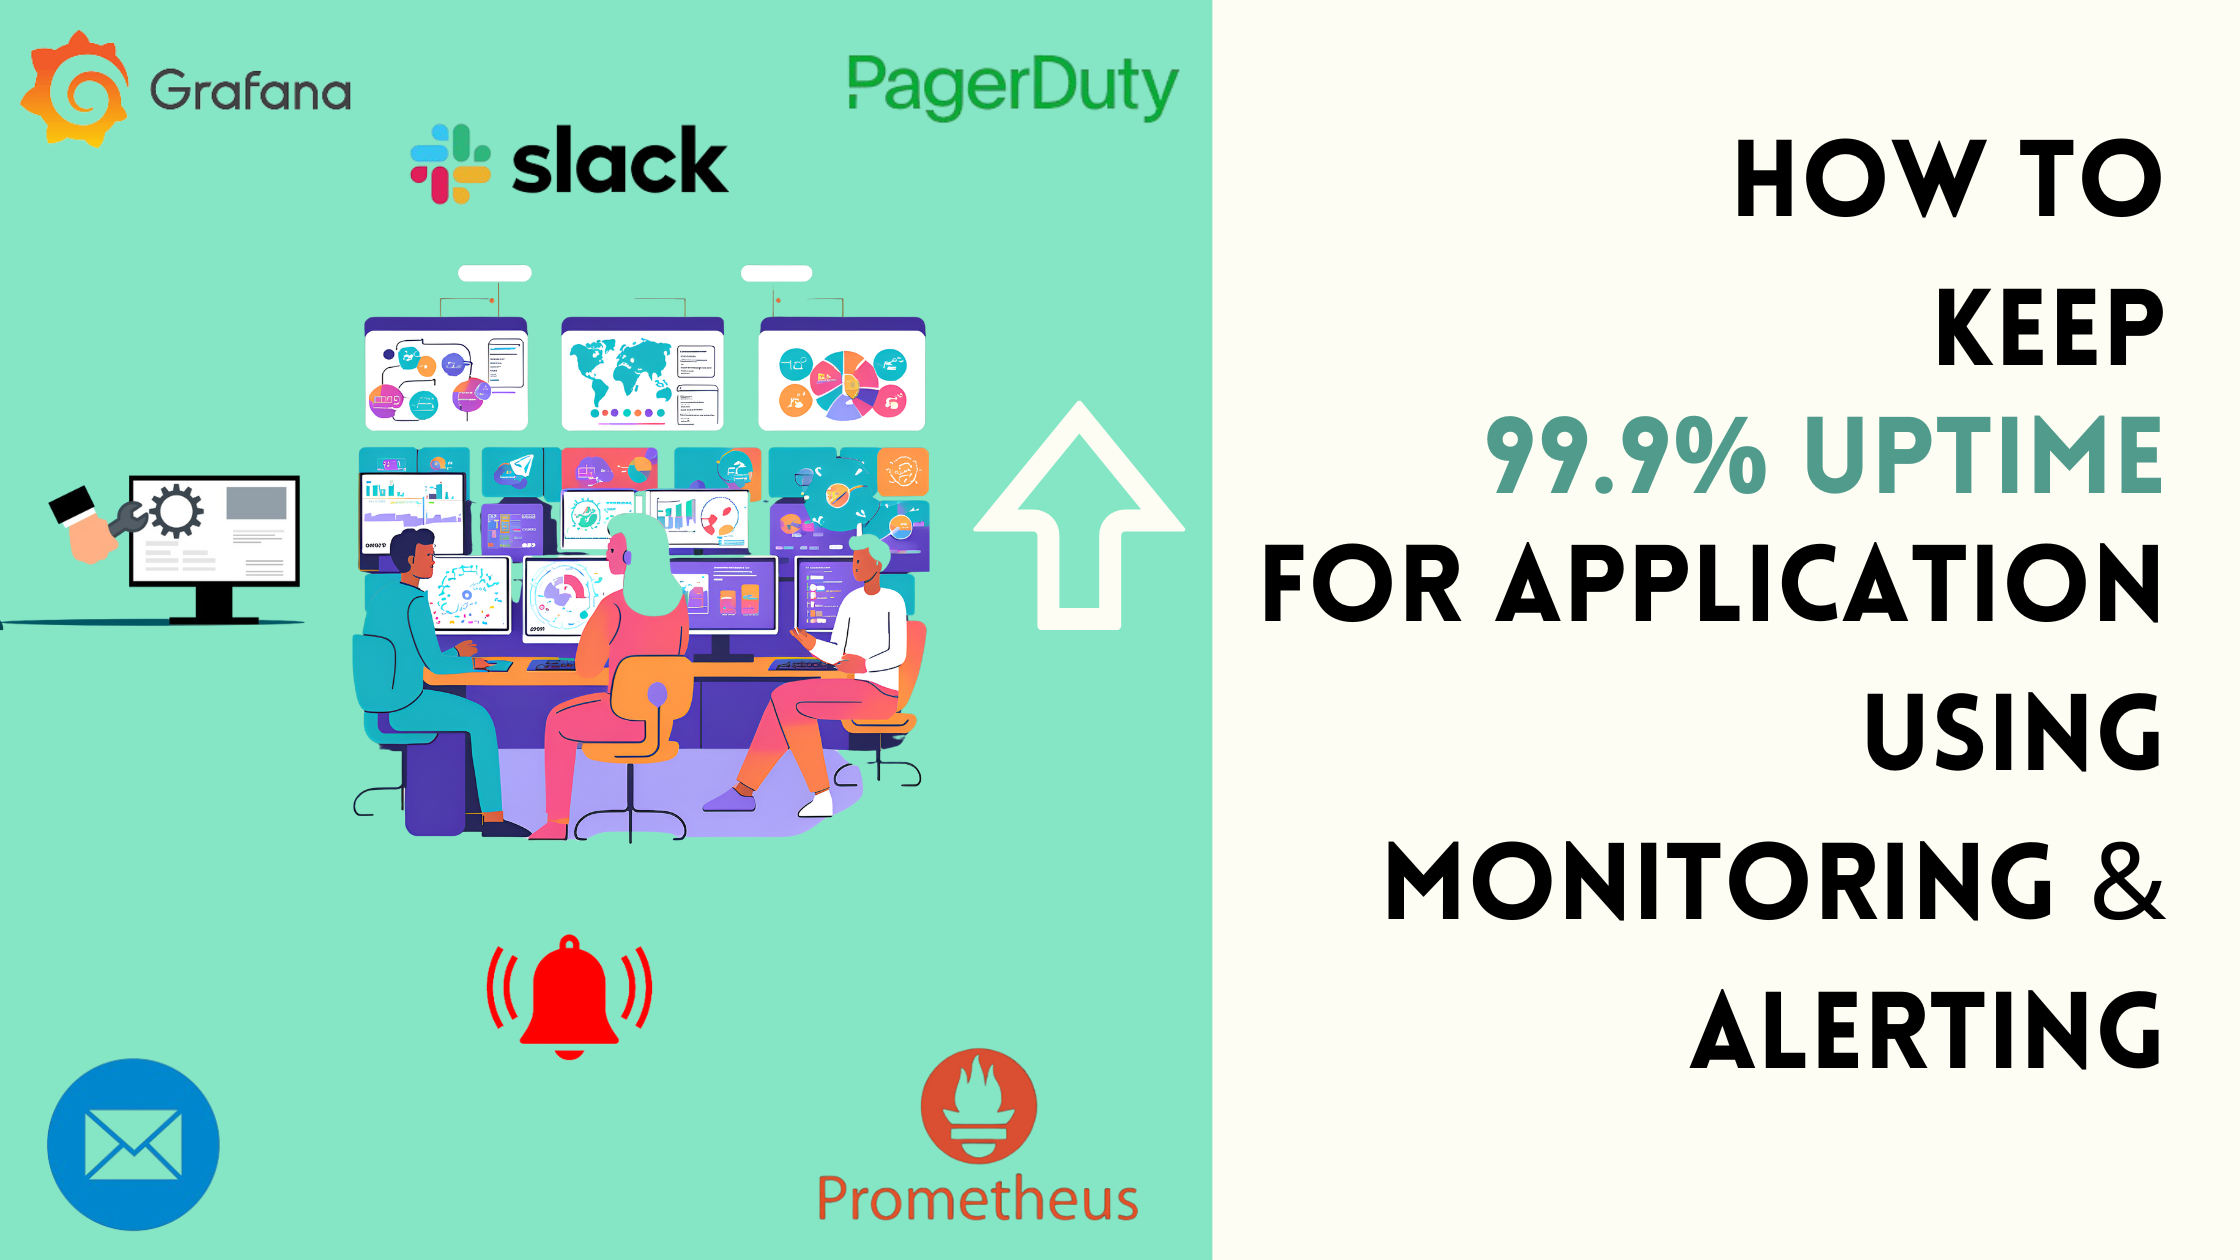
In the fast-paced world of modern software, maintaining high uptime for application is critical for providing a flawless user experience and meeting business requirements in the fast-paced world of modern software.
Most of the companies claim that they have an uptime availability of 99.9% for their services.
Let’s understand what 99.9% of uptime availability means.
As 99.9% uptime equates to only about 8.76 hours of downtime per year, hence to make it an ambitious yet achievable goal, we need to have the right tools and practices in place for our services which could help in achieving this goal and improve user experience.
In this blog, we will explore how to achieve this uptime target along with real-world examples to illustrate their impact.

1. Implementing a Robust Proactive Monitoring System
Monitoring is the cornerstone of high availability. Monitoring your network, infrastructure, and application’s critical metrics is essential to effective monitoring. The following are the key elements:
- Monitoring Application Performance (APM):
By monitoring metrics like response time, error rates, and throughput, tools like AppDynamics, Datadog, and New Relic offer insights into the performance of applications.
Example: Configure APM to monitor response times across APIs:- name: api_latency query: avg_over_time(http_request_duration_seconds{job="api"}[5m]) > 500
If the average response time exceeds 500ms, trigger an alert. - Infrastructure Monitoring:
The underlying systems are kept healthy by monitoring infrastructure resources like CPU, memory, disk I/O, and network utilization. For this, tools like Grafana and Prometheus are perfect.alert: High CPU Usage
expr: sum(rate(container_cpu_usage_seconds_total{namespace="prod"}[1m])) by (pod) > 0.8
for: 2m
labels:
severity: warning
annotations:
description: "Pod {{ $labels.pod }} is using >80% CPU." - Synthetic Monitoring:
To test functionality and uptime, simulate user interactions with tools like Selenium or Pingdom.
Tools like Prometheus and Grafana also provide deep visibility into service health and performance metrics. With Prometheus and Grafana, you can build a reliable monitoring system to track the health and performance of your services.
Prometheus for Metrics Collection
Prometheus is a powerful open-source monitoring solution that collects and stores time-series data.
An open-source monitoring tool called Prometheus helps in collecting and analyzing time-series data. Notifications are triggered by its alerting mechanism when predefined thresholds are exceeded.
Key steps to set it up include:
- Install Prometheus: Deploy Prometheus in your infrastructure using Docker, Kubernetes, or a binary distribution.
- Define Targets: Use configuration files to specify endpoints for metrics scraping.
- Setup Alerts: Define alerting rules in Prometheus’ alert manager to identify anomalies such as high CPU usage, memory leaks, or unavailable endpoints.
- Use Exporters: Leverage exporters for monitoring system-level metrics (e.g., node_exporter for Linux systems, sql_exporter for monitoring SQL Databases).
Prometheus: Metrics Collection and Alerting
An open-source monitoring tool called Prometheus helps in collecting and analyzing time-series data. Notifications are triggered by its alerting mechanism when predefined thresholds are exceeded.
Real-World Example: During flash sales, traffic to a global e-commerce platform surged. Real-time CPU and memory utilization of the backend was tracked by Prometheus, which sent out alerts when usage exceeded capacity. This prevented downtime during times of high demand by enabling the team to proactively spin up more instances.
Example: A retail company used Prometheus to monitor its checkout services during Black Friday. When CPU utilization spiked, alerts triggered scaling actions, ensuring zero downtime during their highest traffic event of the year.
Grafana for Visualization
Grafana: Displaying Trends and Metrics
Grafana, a visualization tool, integrates easily with Prometheus to issue alerts and show metrics on dashboards that are easy to use.
Grafana complements Prometheus by offering:
- Custom Dashboards: Create dashboards tailored to your services with metrics like request rates, error counts, and latency.
- Alerts: Configure thresholds for metrics to trigger alerts.
- Data Sources: Integrate Grafana with Prometheus and other tools like Loki for logs.
2. Real-Time Incident Management for uptime for application
PagerDuty is essential for managing and resolving incidents swiftly, minimizing downtime and service degradation.
Integration with Monitoring Tools
PagerDuty integrates seamlessly with monitoring tools like Prometheus and Grafana to escalate alerts automatically.
- Connect PagerDuty to Prometheus Alertmanager to receive alerts directly.
- Use routing rules to send specific alerts to the relevant teams based on severity and service ownership.
A SaaS provider set up PagerDuty to receive alerts from Prometheus when response times exceeded acceptable thresholds. When a database connection pool reached its limit, PagerDuty escalated the incident to the on-call engineer, who resolved it within 10 minutes.
On-Call Scheduling and Escalation Policies
PagerDuty ensures 24/7 availability with automated on-call schedules and escalation policies.
PagerDuty acts as a reliable incident management platform to ensure issues are addressed promptly:
- Set up on-call schedules ensuring 24/7 coverage.
- Define escalation policies to alert higher-level responders if an issue remains unresolved.
Example: During a database outage, a SaaS company’s on-call engineer received an alert via PagerDuty and resolved the issue within 15 minutes. Escalation policies ensured swift resolution when the primary responder was briefly unavailable.
Incident Triage and Postmortems
- Enable responders to collaborate and document incidents in real-time.
- Conduct postmortems to analyze root causes and prevent recurrence.
Alerting and Collaboration
- Integration with PagerDuty: Send PagerDuty alerts to dedicated Slack channels.
- Incident Channels: Create incident-specific Slack channels for real-time updates and discussions.
- Automated Notifications: Use bots or integrations to post critical alerts and metrics graphs directly from Grafana.
Runbooks and Knowledge Sharing
- Link runbooks to alerts in PagerDuty/Slack for quick troubleshooting.
- Maintain a knowledge repository for common incident resolutions.
Centralized Alerting
Integrate all alerts into a single platform like PagerDuty, Opsgenie, or VictorOps for streamlined incident management.
Example: Use PagerDuty’s on-call schedules to route critical alerts to the right team during off-hours.
3. Automation and Proactive Measures
Auto-Remediation
- Use automation tools to resolve common issues automatically, such as restarting services or scaling pods in Kubernetes.
Capacity Planning
- Analyze historical metrics with Prometheus and Grafana to predict and address resource needs proactively.
Example: A video conferencing service used capacity planning to scale resources during peak hours, avoiding service degradation during remote work surges.
Service-Level Objectives (SLOs)
- Define and monitor SLOs and SLIs (Service-Level Indicators) to ensure performance aligns with user expectations.
4. Best Practices for Achieving High Uptime
Redundancy and Failover
- Deploy redundant instances of critical services across multiple zones or regions.
- Use load balancers to distribute traffic and minimize the impact of failures.
Continuous Testing
- Implement chaos engineering to test system resilience under adverse conditions.
- Conduct regular failover tests to validate redundancy setups.
Regular Reviews
- Periodically review monitoring dashboards, alerts, and on-call schedules.
- Update runbooks and escalation policies based on the past history or steps taken during incident resolution learned.
- Work with your team members to create a feedback system. Utilize these recommendations to keep refining your infrastructure management processes.
Planning for disaster recovery and business continuity:
- Make sure your backup and recovery plan is extensive, including frequent backups along with testing and well-practiced ways of system restoration in the event of an emergency.
Performance optimization:
- Review the performance of your infrastructure on a regular basis. Adopt autoscaling to handle your workloads and assess how to optimize the cost of your cloud resources.
Standardization and documentation:
- Put in place comprehensive documentation that covers the infrastructure and operational protocols. To make maintenance and troubleshooting easier, make sure the environment is consistent and free of inconsistencies.
Constant learning and development:
- Cloud technologies and best practices are evolving quickly. Keep yourself and your group informed on the latest developments in technology and trends.
5. Monitor SLAs and SLOs
Define and track Service Level Agreements (SLAs) and Service Level Objectives (SLOs) to measure uptime.
We can track the SLAs for our applications via the automated monthly report which can send out these reports month-wise and which can be reviewed with the team to take preventive measures so as to keep the uptime 99.9%.
Conclusion
Achieving 99.9% uptime is a multi-faceted challenge that requires robust monitoring, effective incident management, and streamlined communication. By leveraging different tools like Prometheus and Grafana for proactive monitoring, PagerDuty for incident resolution, and Slack for collaboration, organizations can ensure their services remain reliable and performant. Combine these tools with automation and best practices to build a resilient infrastructure that meets the demands of today’s digital economy.
🚩 Our Recent Posts
- How to Reduce/Save Costs on Microsoft Azure Log Analytics Workspace: Tips & Best Practices
- What is Grafana? How to Install and Set Up Grafana for Effective Data Visualization?
- Monitor your MongoDB using Mongo Exporter in Prometheus | in simple steps
- How to Monitor your Kubernetes Cluster using Prometheus Easily – Beginners Guide
- How to setup and monitor Endpoints using Blackbox Exporter in Prometheus using simple Steps?
- How to setup a monitoring for TCP Endpoints using Blackbox Exporter in easy steps?
- How to Set Up Federate Jobs in Prometheus: A Simple Guide to Understanding Federate Jobs
I am WordPress specialist focused on site optimization, SEO, performance tuning, and user experience. Passionate about digital growth, I share insights on improving website speed, security, and search rankings to help others enhance their online presence.
Subscribe to our Newsletter
Please susbscribe


